Quincy: Fire Incidents, Illinois (IL)
Where are fire incidents reported in Quincy, IL
Something went wrong! Please refresh the page.
| Fire incidents reported | |
|---|---|
| Sreet name | Count |
| BROADWAY ST | 346 |
| 5TH ST | 232 |
| 12TH ST | 224 |
| 8TH ST | 208 |
| 6TH ST | 202 |
| 4TH ST | 186 |
| 24TH ST | 168 |
| STATE ST | 140 |
| GARDNER EXPY | 122 |
| MAINE ST | 112 |
| OAK ST | 108 |
| CHERRY ST | 104 |
| 7TH ST | 102 |
| CHESTNUT ST | 102 |
| HAMPSHIRE ST | 100 |
| LOCUST ST | 90 |
| HARRISON ST | 88 |
| WASHINGTON ST | 86 |
| 3RD ST | 84 |
| LIND ST | 82 |
| 30TH ST | 78 |
| 36TH ST | 78 |
| 9TH ST | 78 |
| 18TH ST | 76 |
| PAYSON AVE | 76 |
| JEFFERSON ST | 72 |
| 10TH ST | 68 |
| CEDAR ST | 66 |
| ELM ST | 66 |
| COLLEGE AVE | 64 |
2002 - 2018 National Fire Incident Reporting System (NFIRS) incidents
- Incident types reported to NFIRS in Quincy, IL
- 13,65345.6%Rescue & EMS
- 4,85716.2%Hazardous Condition
- 3,60812.1%Fire
- 2,9479.9%False Alarm
- 2,6718.9%Good Intent Call
- 2,0416.8%Service Call
- 720.2%Special Incident
- 550.2%Overpressure Rupture
- Fire incident types reported to NFIRS in Quincy, IL
- 1,67446.4%Outside Fires
- 1,41239.1%Structure Fires
- 50714.1%Mobile Property/Vehicle Fires
- 150.4%Other
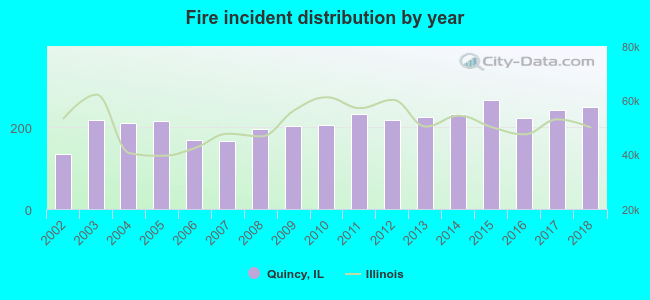 According to the data from the years 2002 - 2018 the average number of fire incidents per year is 212. The highest number of fire incidents - 266 took place in 2015, and the least - 135 in 2002. The data has a growing trend.
The average number of yearly fire incidents per 10k residents in Quincy, IL compared to nearest cities:
(Note: Based on data for the last 3 years, including only cities with population 5,000 and above)
| Quincy: | 58.2 |
 The median response time based on all reported fire incidents is 4 minutes. This is lower compared to the state median value.
The median response time in Quincy, IL compared to nearest cities:
(Note: Based on data for all years, including only cities with at least 500 fire incidents)
| Quincy: | 4 minutes |
| Pittsfield: | 8 minutes |
 Based on the data from the years 2002 - 2018 the average number of fire-related yearly deaths is 1. The highest number of deaths - 6 took place in 2007, and the lowest - 0 in 2002. The data has an increasing trend.
The average number of deaths per 1,000 fire incidents is 7. This indicator was the highest - 36 in 2007, and the lowest 0 in 2002. The trend for fatalities per 1,000 fires is rising. Compared to the state value the number of fatalities per 1,000 fire incidents is much higher.
Based on the data from the years 2002 - 2018 the average number of fire-related yearly deaths is 1. The highest number of deaths - 6 took place in 2007, and the lowest - 0 in 2002. The data has an increasing trend.
The average number of deaths per 1,000 fire incidents is 7. This indicator was the highest - 36 in 2007, and the lowest 0 in 2002. The trend for fatalities per 1,000 fires is rising. Compared to the state value the number of fatalities per 1,000 fire incidents is much higher.Deaths per 1,000 incidents in Quincy, IL compared to nearest cities:
(Note: Based on data for all years, including only cities with at least 2,500 fire incidents)
| Quincy: | 6.7 |
 According to the reports from the years 2002 - 2018 the average number of fire-related yearly casualties is 4. The highest number of injuries - 13 took place in 2011, and the lowest - 0 in 2005. The data has a growing trend.
The average number of casualties per 1,000 fire incidents is 21. This indicator was the highest - 56 in 2011, and the lowest 0 in 2005. The trend for injuries per 1,000 fires is growing. Compared to the Illinois value the number of casualties per 1,000 incidents is higher.
According to the reports from the years 2002 - 2018 the average number of fire-related yearly casualties is 4. The highest number of injuries - 13 took place in 2011, and the lowest - 0 in 2005. The data has a growing trend.
The average number of casualties per 1,000 fire incidents is 21. This indicator was the highest - 56 in 2011, and the lowest 0 in 2005. The trend for injuries per 1,000 fires is growing. Compared to the Illinois value the number of casualties per 1,000 incidents is higher.Casualties per 1,000 incidents in Quincy, IL compared to nearest cities:
(Note: Based on data for all years, including only cities with at least 500 fire incidents)
| Quincy: | 21.1 |
| Pittsfield: | 1.9 |
 29.2% incidents where reported in the morning and 70.8% in the evening. The most fires (15.9%) took place on Saturday, and the least (13.2%) on Monday.
 According to the 3,608 incident reports from years 2002 - 2018 most fires (10.5%) took place during April, and the least (6.2%) in February.
 Out of all 29,913 cases reported during the years 2002 - 2018, the most belonged to the categories: Rescue & EMS (45.6%), Hazardous Condition (16.2%), and Fire (12.1%).
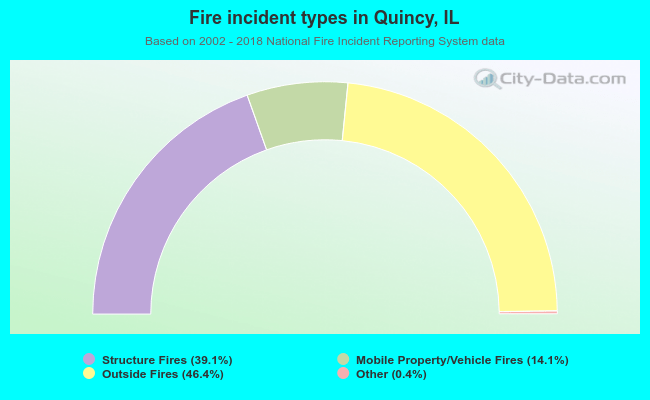 When looking into fire subcategories, the most incidents belonged to: Outside Fires (46.4%), and Structure Fires (39.1%).