Punta Gorda: Fire Incidents, Florida (FL)
Where are fire incidents reported in Punta Gorda, FL
Something went wrong! Please refresh the page.
| Fire incidents reported | |
|---|---|
| Sreet name | Count |
| TAMIAMI TRL | 206 |
| BERMONT RD | 204 |
| SR 31 | 166 |
| I75 | 152 |
| MARION AVE | 140 |
| OIL WELL RD | 114 |
| BURNT STORE RD | 112 |
| DUNCAN RD | 82 |
| BERMONT RD | 78 |
| JONES LOOP RD | 72 |
| AIRPORT RD | 64 |
| ZEMEL RD | 62 |
| I-75 | 60 |
| TAYLOR RD | 60 |
| WASHINGTON LOOP RD | 60 |
| RETTA ESPLANADE | 56 |
| TUCKERS GRADE | 56 |
| BURNT STORE RD | 50 |
| COOPER ST | 50 |
| DUNCAN ROAD | 46 |
| TAMIAMI TR | 46 |
| WASHINGTON LOOP RD | 40 |
| AIRPORT RD | 36 |
| JONES LOOP RD | 36 |
| DUNCAN RD // CLEVELAND AVE | 34 |
| BAL HARBOR BLVD | 30 |
| GREEN GULF BLVD | 30 |
| RIVERSIDE DR | 30 |
| TAMIAMI | 30 |
| SLASH PINE CIR | 28 |
| Other | 1,739 |
2002 - 2018 National Fire Incident Reporting System (NFIRS) incidents
- Incident types reported to NFIRS in Punta Gorda, FL
- 35,64664.2%Rescue & EMS
- 6,00710.8%Service Call
- 4,4808.1%Hazardous Condition
- 3,9697.1%Fire
- 3,8066.9%Good Intent Call
- 1,5032.7%False Alarm
- Fire incident types reported to NFIRS in Punta Gorda, FL
- 2,50763.2%Outside Fires
- 65816.6%Mobile Property/Vehicle Fires
- 63516.0%Structure Fires
- 1694.3%Other
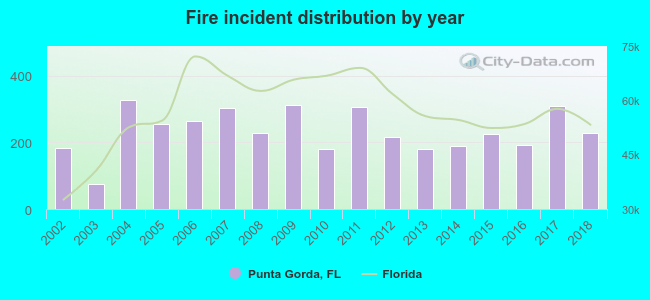 According to the data from the years 2002 - 2018 the average number of fire incidents per year is 233. The highest number of fire incidents - 326 took place in 2004, and the least - 74 in 2003. The data has a growing trend.
The average number of yearly fire incidents per 10k residents in Punta Gorda, FL compared to nearest cities:
(Note: Based on data for the last 3 years, including only cities with population 5,000 and above)
| Punta Gorda: | 138.1 |
| Port Charlotte: | 59.1 |
| North Port: | 36.2 |
| Rotonda: | 5.3 |
| Warm Mineral Springs: | 14.8 |
| North Fort Myers: | 59.6 |
| Englewood: | 20.0 |
| Cape Coral: | 14.4 |
| Fort Myers: | 97.1 |
 The median response time based on all reported fire incidents is 7 minutes. This is similar to the Florida median value.
The median response time in Punta Gorda, FL compared to nearest cities:
(Note: Based on data for all years, including only cities with at least 500 fire incidents)
| Punta Gorda: | 7 minutes |
| Port Charlotte: | 6 minutes |
| North Port: | 7 minutes |
| North Fort Myers: | 6 minutes |
| Englewood: | 6 minutes |
| Cape Coral: | 6 minutes |
| Fort Myers: | 5 minutes |
| Arcadia: | 7 minutes |
| Venice: | 6 minutes |
 According to the data from the years 2002 - 2018 the average number of fire-related fatalities per year is 1. The highest number of deaths - 3 took place in 2016, and the lowest - 0 in 2002. The data has a constant trend.
The average number of fatalities per 1,000 fire incidents is 2. This indicator was the highest - 16 in 2016, and the lowest 0 in 2002. The trend for fatalities per 1,000 incidents is constant. Compared to the state value the number of fatalities per 1,000 incidents is higher.
According to the data from the years 2002 - 2018 the average number of fire-related fatalities per year is 1. The highest number of deaths - 3 took place in 2016, and the lowest - 0 in 2002. The data has a constant trend.
The average number of fatalities per 1,000 fire incidents is 2. This indicator was the highest - 16 in 2016, and the lowest 0 in 2002. The trend for fatalities per 1,000 incidents is constant. Compared to the state value the number of fatalities per 1,000 incidents is higher.Deaths per 1,000 incidents in Punta Gorda, FL compared to nearest cities:
(Note: Based on data for all years, including only cities with at least 2,500 fire incidents)
| Punta Gorda: | 2.3 |
| Port Charlotte: | 0.8 |
| North Port: | 0.6 |
| North Fort Myers: | 1.7 |
| Cape Coral: | 1.2 |
| Fort Myers: | 2.7 |
| Arcadia: | 0.9 |
| Lehigh Acres: | 0.5 |
 According to the data from the years 2002 - 2018 the average number of fire-related casualties per year is 1. The highest number of casualties - 4 took place in 2013, and the lowest - 0 in 2003. The data has a declining trend.
The average number of injuries per 1,000 fire incidents is 6. This indicator was the highest - 22 in 2013, and the lowest 0 in 2003. The trend for injuries per 1,000 fire incidents is dropping. Compared to the state value the number of injuries per 1,000 fire incidents is much lower.
According to the data from the years 2002 - 2018 the average number of fire-related casualties per year is 1. The highest number of casualties - 4 took place in 2013, and the lowest - 0 in 2003. The data has a declining trend.
The average number of injuries per 1,000 fire incidents is 6. This indicator was the highest - 22 in 2013, and the lowest 0 in 2003. The trend for injuries per 1,000 fire incidents is dropping. Compared to the state value the number of injuries per 1,000 fire incidents is much lower.Casualties per 1,000 incidents in Punta Gorda, FL compared to nearest cities:
(Note: Based on data for all years, including only cities with at least 500 fire incidents)
| Punta Gorda: | 5.3 |
| Port Charlotte: | 13.3 |
| North Port: | 4.3 |
| North Fort Myers: | 7.1 |
| Englewood: | 2.0 |
| Cape Coral: | 13.1 |
| Fort Myers: | 15.4 |
| Arcadia: | 3.1 |
| Venice: | 4.0 |
 22.6% incidents where reported in the morning and 77.4% in the evening. The most fires (15.6%) took place on Saturday, and the least (12.8%) on Thursday.
 According to the 3,969 fire incidents from years 2002 - 2018 most fires (13.1%) took place during May, and the least (5.1%) in October.
 Out of all 55,528 cases reported during the years 2002 - 2018, the most belonged to the categories: Rescue & EMS (64.2%), Service Call (10.8%), and Hazardous Condition (8.1%).
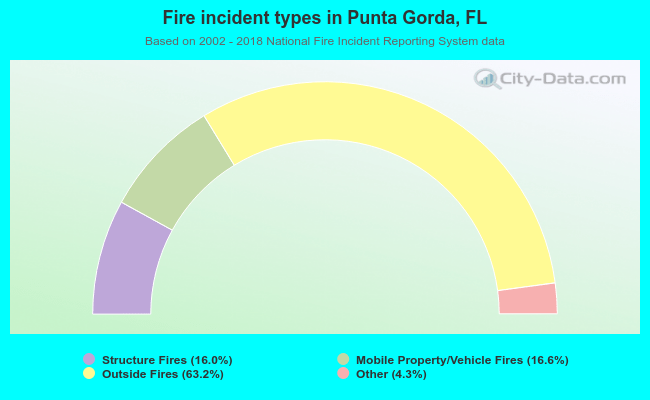 When looking into fire subcategories, the most incidents belonged to: Outside Fires (63.2%), and Mobile Property/Vehicle Fires (16.6%).