Pleasantville: Fire Incidents, New Jersey (NJ)
Where are fire incidents reported in Pleasantville, NJ
Something went wrong! Please refresh the page.
| Fire incidents reported | |
|---|---|
| Sreet name | Count |
| MAIN STREET NORTH | 316 |
| BLACK HORSE PIKE | 200 |
| DELILAH ROAD WEST | 150 |
| MAIN STREET SOUTH | 110 |
| MAIN ST | 98 |
| NEW ROAD NORTH | 86 |
| ATLANTIC AVENUE | 74 |
| LEEDS AVENUE WEST | 72 |
| ATLANTIC CITY EXPRESSWAY | 60 |
| FALCON DRIVE | 60 |
| BLACK HORSE PIKE | 56 |
| ADAMS AVENUE WEST | 46 |
| LINDEN AVENUE | 46 |
| WOODLAND AVENUE | 40 |
| BROAD STREET | 36 |
| CHURCH STREET | 36 |
| DOUGHTY ROAD | 36 |
| MAIN STREET | 36 |
| MILL ROAD | 36 |
| PARK AVENUE WEST | 36 |
| FRANKLIN AVENUE | 34 |
| SECOND STREET NORTH | 32 |
| WOODLAND TER | 32 |
| WEST JERSEY AVENUE EAST | 30 |
| NEW ROAD SOUTH | 28 |
| WASHINGTON AVENUE WEST | 28 |
| FRANKLIN BOULEVARD | 26 |
| MANOR DRIVE | 26 |
| PARK AVENUE | 24 |
| READING AVENUE WEST | 24 |
2002 - 2018 National Fire Incident Reporting System (NFIRS) incidents
- Incident types reported to NFIRS in Pleasantville, NJ
- 7,49243.6%Rescue & EMS
- 3,21118.7%Hazardous Condition
- 2,00211.6%False Alarm
- 1,89311.0%Fire
- 1,0656.2%Good Intent Call
- 1,0205.9%Service Call
- 4612.7%Special Incident
- 370.2%Severe Weather
- Fire incident types reported to NFIRS in Pleasantville, NJ
- 96350.9%Structure Fires
- 60131.7%Outside Fires
- 23412.4%Mobile Property/Vehicle Fires
- 955.0%Other
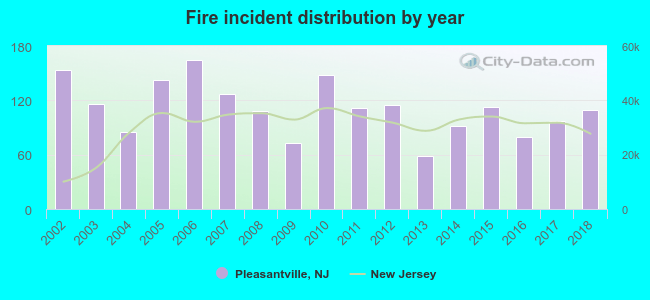 According to the data from the years 2002 - 2018 the average number of fire incidents per year is 111. The highest number of fires - 165 took place in 2006, and the least - 58 in 2013. The data has a dropping trend.
The average number of yearly fire incidents per 10k residents in Pleasantville, NJ compared to nearest cities:
(Note: Based on data for the last 3 years, including only cities with population 5,000 and above)
| Pleasantville: | 46.4 |
| Northfield: | 31.0 |
| Absecon: | 17.1 |
| Linwood: | 12.3 |
| Margate City: | 34.2 |
| Atlantic City: | 61.0 |
| Pomona: | 23.9 |
| Somers Point: | 43.1 |
| Brigantine: | 37.1 |
 The median response time based on all reported fire incidents is 2 minutes. This is much lower than the state median value.
The median response time in Pleasantville, NJ compared to nearest cities:
(Note: Based on data for all years, including only cities with at least 500 fire incidents)
| Pleasantville: | 2 minutes |
| Atlantic City: | 5 minutes |
| Somers Point: | 6 minutes |
| Brigantine: | 3 minutes |
| Ocean City: | 2 minutes |
| Mays Landing: | 6 minutes |
| Hammonton: | 7 minutes |
| Manahawkin: | 4 minutes |
| Vineland: | 6 minutes |
 According to the reports from the years 2002 - 2018 the average number of fire-related fatalities per year is 0. The highest number of reported deaths - 2 took place in 2014, and the lowest - 0 in 2002. The data has a constant trend.
 Based on the data from the years 2002 - 2018 the average number of fire-related casualties per year is 3. The highest number of reported casualties - 6 took place in 2005, and the lowest - 0 in 2004. The data has a decreasing trend.
The average number of injuries per 1,000 fire incidents is 22. This indicator was the highest - 55 in 2009, and the lowest 0 in 2004. The trend for casualties per 1,000 fire incidents is decreasing. Compared to the state value the number of injuries per 1,000 fire incidents is much higher.
Based on the data from the years 2002 - 2018 the average number of fire-related casualties per year is 3. The highest number of reported casualties - 6 took place in 2005, and the lowest - 0 in 2004. The data has a decreasing trend.
The average number of injuries per 1,000 fire incidents is 22. This indicator was the highest - 55 in 2009, and the lowest 0 in 2004. The trend for casualties per 1,000 fire incidents is decreasing. Compared to the state value the number of injuries per 1,000 fire incidents is much higher.Casualties per 1,000 incidents in Pleasantville, NJ compared to nearest cities:
(Note: Based on data for all years, including only cities with at least 500 fire incidents)
| Pleasantville: | 22.7 |
| Atlantic City: | 10.3 |
| Somers Point: | 8.7 |
| Brigantine: | 20.8 |
| Ocean City: | 12.1 |
| Mays Landing: | 1.8 |
| Hammonton: | 5.4 |
| Manahawkin: | 10.8 |
| Vineland: | 21.5 |
 29.4% incidents where reported in the morning and 70.6% in the evening. The most fires (14.9%) took place on Saturday, and the least (13.8%) on Monday.
 Based on the 1,893 incident reports from years 2002 - 2018 most fires (10.7%) took place during May, and the least (6.5%) in November.
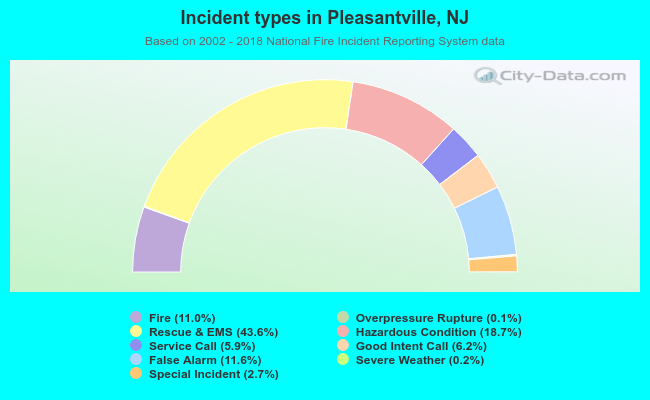 Out of all 17,194 cases reported during the years 2002 - 2018, the most belonged to the categories: Rescue & EMS (43.6%), Hazardous Condition (18.7%), and False Alarm (11.6%).
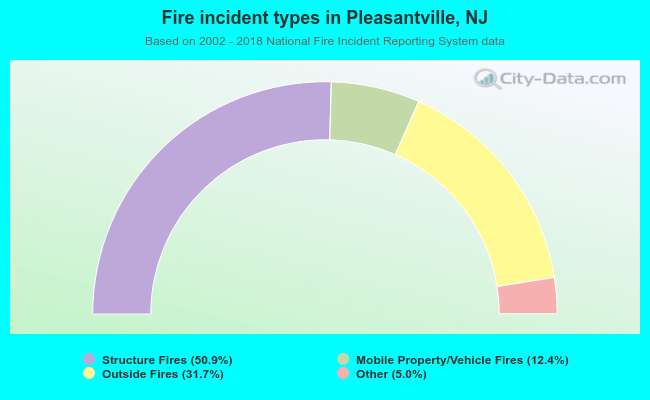 When looking into fire subcategories, the most incidents belonged to: Structure Fires (50.9%), and Outside Fires (31.7%).