Plattsmouth: Fire Incidents, Nebraska (NE)
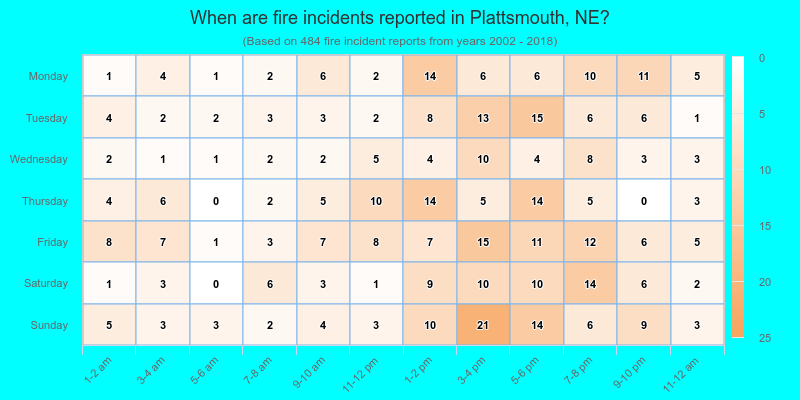
Where are fire incidents reported in Plattsmouth, NE
Something went wrong! Please refresh the page.
|
| |||||||||||||||||||||||||||||||||||||||||||||||||||||||||||||||||||||||||||||||||||||||||||||||||||||||||||||
2002 - 2018 National Fire Incident Reporting System (NFIRS) incidents
- Incident types reported to NFIRS in Plattsmouth, NE
- 60333.5%Hazardous Condition
- 48426.9%Fire
- 36820.5%Rescue & EMS
- 19110.6%Good Intent Call
- 703.9%Service Call
- 693.8%False Alarm
- 70.4%Overpressure Rupture
- 40.2%Severe Weather
- 20.1%Special Incident
- Fire incident types reported to NFIRS in Plattsmouth, NE
- 22245.9%Structure Fires
- 18638.4%Outside Fires
- 6313.0%Mobile Property/Vehicle Fires
- 132.7%Other
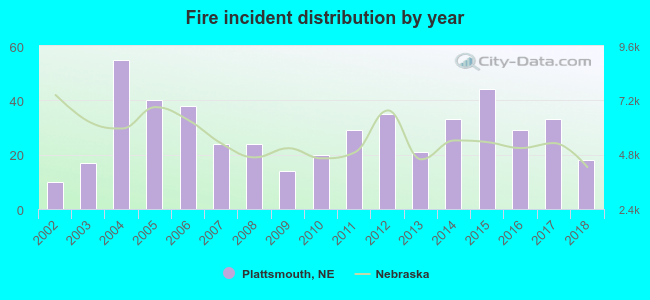 According to the data from the years 2002 - 2018 the average number of fires per year is 28. The highest number of reported fires - 55 took place in 2004, and the least - 10 in 2002. The data has a growing trend.
The average number of yearly fire incidents per 10k residents in Plattsmouth, NE compared to nearest cities:
(Note: Based on data for the last 3 years, including only cities with population 5,000 and above)
| Plattsmouth: | 41.1 |
| Bellevue: | 18.4 |
| Papillion: | 2.7 |
| La Vista: | 3.8 |
| Ralston: | 8.3 |
| Omaha: | 35.9 |
| Gretna: | 61.7 |
| Nebraska City: | 24.3 |
| Elkhorn: | 1.5 |
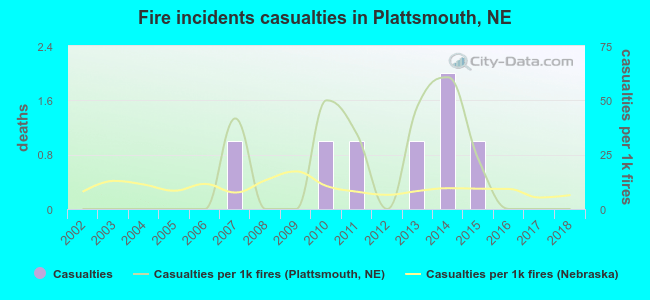 Based on the reports from the years 2002 - 2018 the average number of fire-related yearly casualties is 0. The highest number of casualties - 2 took place in 2014, and the lowest - 0 in 2002. The data has a constant trend.
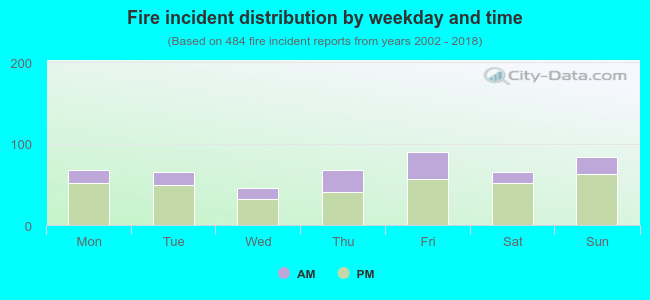 28.9% incidents where reported in the morning and 71.1% in the evening. The most fires (18.6%) took place on Friday, and the least (9.3%) on Wednesday.
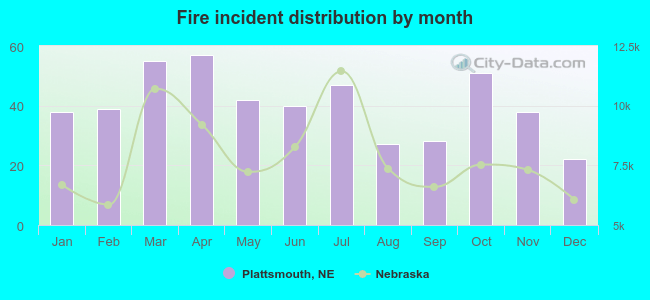 According to the 484 fires from years 2002 - 2018 most fires (11.8%) took place during April, and the least (4.5%) in December.
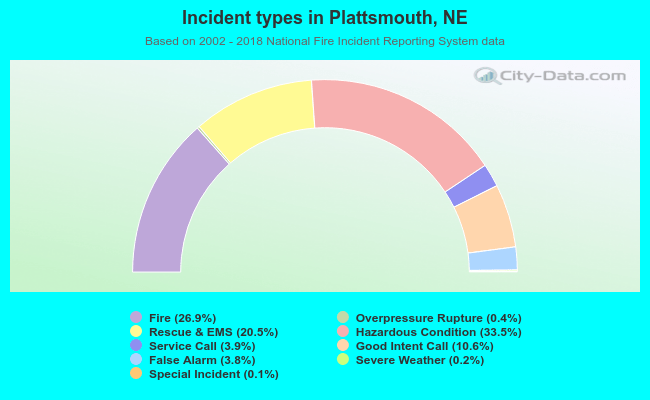 Out of all 1,798 cases reported during the years 2002 - 2018, the most belonged to the categories: Hazardous Condition (33.5%), Fire (26.9%), and Rescue & EMS (20.5%).
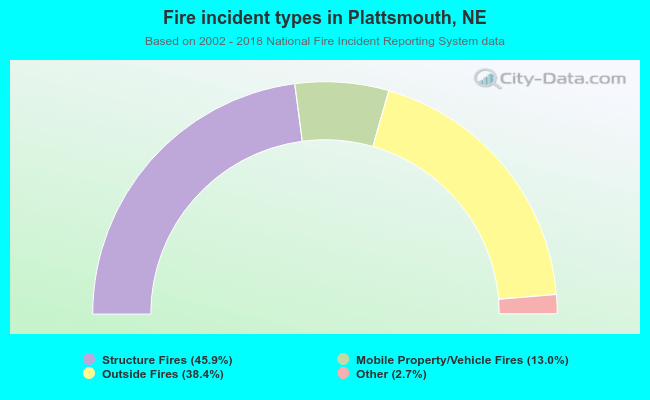 When looking into fire subcategories, the most reports belonged to: Structure Fires (45.9%), and Outside Fires (38.4%).