Plano: Fire Incidents, Texas (TX)
Where are fire incidents reported in Plano, TX
Something went wrong! Please refresh the page.
| Fire incidents reported | |
|---|---|
| Sreet name | Count |
| CENTRAL EXPY | 438 |
| PARK BLVD | 428 |
| SPRING CREEK PKY | 392 |
| PARKER RD | 378 |
| PRESTON RD | 378 |
| PLANO PKY | 366 |
| LEGACY DR | 318 |
| COIT RD | 288 |
| 14TH ST | 248 |
| INDEPENDENCE PKY | 240 |
| K AVE | 222 |
| 15TH ST | 214 |
| CUSTER RD | 212 |
| OHIO DR | 204 |
| DALLAS PKY | 186 |
| ALMA DR | 170 |
| JUPITER RD | 128 |
| PRES GEORGE BUSH TPKE | 126 |
| SH121 HWY | 116 |
| SHILOH RD | 110 |
| US 75 NB | 90 |
| 18TH ST | 82 |
| PRES GEORGE BUSH HWY | 76 |
| US 75 SB | 70 |
| HEDGCOXE RD | 64 |
| RIGSBEE DR | 62 |
| 16TH ST | 54 |
| WINDHAVEN PKY | 52 |
| LOS RIOS BLVD | 50 |
| HILLRIDGE DR | 48 |
| Other | 612 |
2003 - 2018 National Fire Incident Reporting System (NFIRS) incidents
- Incident types reported to NFIRS in Plano, TX
- 68,30857.5%Rescue & EMS
- 15,72313.2%Good Intent Call
- 10,1548.6%Service Call
- 9,6938.2%Hazardous Condition
- 8,1886.9%False Alarm
- 6,4225.4%Fire
- Fire incident types reported to NFIRS in Plano, TX
- 2,56740.0%Outside Fires
- 2,52139.3%Structure Fires
- 1,21218.9%Mobile Property/Vehicle Fires
- 1221.9%Other
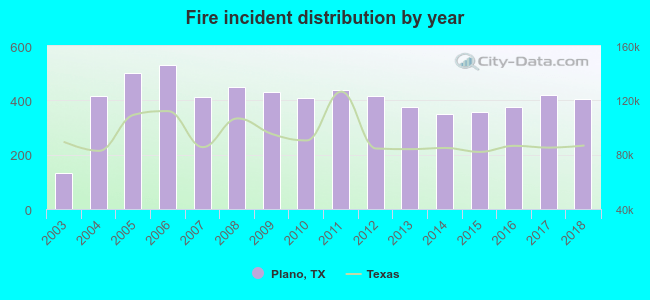 According to the data from the years 2003 - 2018 the average number of fire incidents per year is 401. The highest number of fires - 529 took place in 2006, and the least - 132 in 2003. The data has an increasing trend.
The average number of yearly fire incidents per 10k residents in Plano, TX compared to nearest cities:
(Note: Based on data for the last 3 years, including only cities with population 5,000 and above)
| Plano: | 14.4 |
| Allen: | 14.0 |
| Richardson: | 18.0 |
| Frisco: | 17.9 |
| Addison: | 50.9 |
| The Colony: | 16.8 |
| Murphy: | 16.6 |
| Colony: | 0.2 |
| Carrollton: | 24.4 |
 The median response time based on all reported fire incidents is 5 minutes. This is lower than the state median value.
The median response time in Plano, TX compared to nearest cities:
(Note: Based on data for all years, including only cities with at least 500 fire incidents)
| Plano: | 5 minutes |
| Allen: | 6 minutes |
| Richardson: | 5 minutes |
| Frisco: | 5 minutes |
| Addison: | 5 minutes |
| The Colony: | 5 minutes |
| Carrollton: | 5 minutes |
| Lucas: | 9 minutes |
| Sachse: | 6 minutes |
 Based on the reports from the years 2003 - 2018 the average number of fire-related fatalities per year is 1. The highest number of reported deaths - 4 took place in 2009, and the lowest - 0 in 2003. The data has a constant trend.
The average number of fatalities per 1,000 fire incidents is 3. This indicator was the highest - 10 in 2017, and the lowest 0 in 2003. The trend for fatalities per 1,000 incidents is decreasing. Compared to the Texas value the number of deaths per 1,000 incidents is higher.
Based on the reports from the years 2003 - 2018 the average number of fire-related fatalities per year is 1. The highest number of reported deaths - 4 took place in 2009, and the lowest - 0 in 2003. The data has a constant trend.
The average number of fatalities per 1,000 fire incidents is 3. This indicator was the highest - 10 in 2017, and the lowest 0 in 2003. The trend for fatalities per 1,000 incidents is decreasing. Compared to the Texas value the number of deaths per 1,000 incidents is higher.Deaths per 1,000 incidents in Plano, TX compared to nearest cities:
(Note: Based on data for all years, including only cities with at least 2,500 fire incidents)
| Plano: | 3.0 |
| Richardson: | 1.5 |
| Frisco: | 1.3 |
| Carrollton: | 1.7 |
| Garland: | 2.2 |
| McKinney: | 2.8 |
| Lewisville: | 2.2 |
| Dallas: | 1.5 |
| Irving: | 0.7 |
 Based on the data from the years 2003 - 2018 the average number of fire-related casualties per year is 4. The highest number of casualties - 9 took place in 2010, and the lowest - 1 in 2016. The data has a rising trend.
The average number of casualties per 1,000 fire incidents is 11. This indicator was the highest - 22 in 2010, and the lowest 3 in 2016. The trend for injuries per 1,000 fires is declining. Compared to the state value the number of casualties per 1,000 incidents is higher.
Based on the data from the years 2003 - 2018 the average number of fire-related casualties per year is 4. The highest number of casualties - 9 took place in 2010, and the lowest - 1 in 2016. The data has a rising trend.
The average number of casualties per 1,000 fire incidents is 11. This indicator was the highest - 22 in 2010, and the lowest 3 in 2016. The trend for injuries per 1,000 fires is declining. Compared to the state value the number of casualties per 1,000 incidents is higher.Casualties per 1,000 incidents in Plano, TX compared to nearest cities:
(Note: Based on data for all years, including only cities with at least 500 fire incidents)
| Plano: | 11.1 |
| Allen: | 7.1 |
| Richardson: | 24.9 |
| Frisco: | 14.0 |
| Addison: | 4.6 |
| The Colony: | 7.1 |
| Carrollton: | 14.1 |
| Lucas: | 1.3 |
| Sachse: | 15.9 |
 28.9% incidents where reported in the morning and 71.1% in the evening. The most fires (14.9%) took place on Friday, and the least (13.6%) on Tuesday.
 According to the 6,422 incident reports from years 2003 - 2018 most fires (10.4%) took place during July, and the least (6.4%) in September.
 Out of all 118,718 cases reported during the years 2003 - 2018, the most belonged to the categories: Rescue & EMS (57.5%), Good Intent Call (13.2%), and Service Call (8.6%).
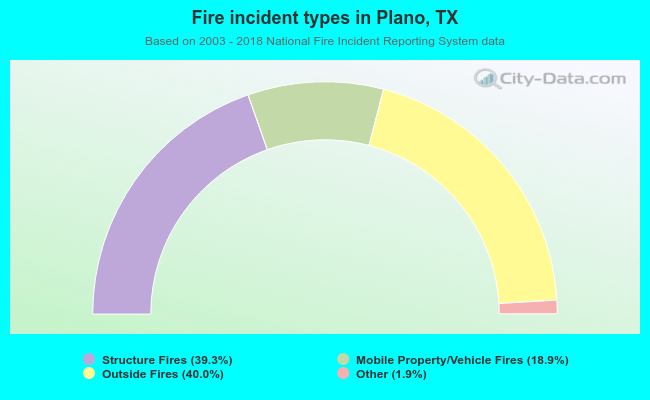 When looking into fire subcategories, the most incidents belonged to: Outside Fires (40.0%), and Structure Fires (39.3%).