Pine Bluff: Fire Incidents, Arkansas (AR)
Where are fire incidents reported in Pine Bluff, AR
Something went wrong! Please refresh the page.
| Fire incidents reported | |
|---|---|
| Sreet name | Count |
| OLIVE ST | 368 |
| 13TH AVE | 262 |
| 6TH AVE | 258 |
| 2ND AVE | 244 |
| 28TH AVE | 234 |
| 11TH AVE | 220 |
| DOLLARWAY RD | 218 |
| 26TH AVE | 216 |
| HARDING AVE | 210 |
| 17TH AVE | 208 |
| OHIO ST | 202 |
| 8TH AVE | 200 |
| 34TH AVE | 188 |
| MAIN ST | 188 |
| 5TH AVE | 186 |
| 25TH AVE | 180 |
| 15TH AVE | 170 |
| BLAKE ST | 162 |
| CHERRY ST | 162 |
| 12TH AVE | 158 |
| 22ND AVE | 156 |
| 7TH AVE | 152 |
| 24TH AVE | 146 |
| 4TH AVE | 144 |
| 9TH AVE | 144 |
| 14TH AVE | 140 |
| 10TH AVE | 138 |
| HAZEL ST | 138 |
| LINDEN ST | 138 |
| 16TH AVE | 132 |
| Other | 5,073 |
2002 - 2018 National Fire Incident Reporting System (NFIRS) incidents
- Incident types reported to NFIRS in Pine Bluff, AR
- 13,07637.8%Rescue & EMS
- 10,73531.1%Fire
- 2,9918.7%Good Intent Call
- 2,8348.2%False Alarm
- 2,5237.3%Hazardous Condition
- 2,2956.6%Service Call
- 700.2%Overpressure Rupture
- Fire incident types reported to NFIRS in Pine Bluff, AR
- 5,00346.6%Structure Fires
- 3,60533.6%Outside Fires
- 1,84917.2%Mobile Property/Vehicle Fires
- 2782.6%Other
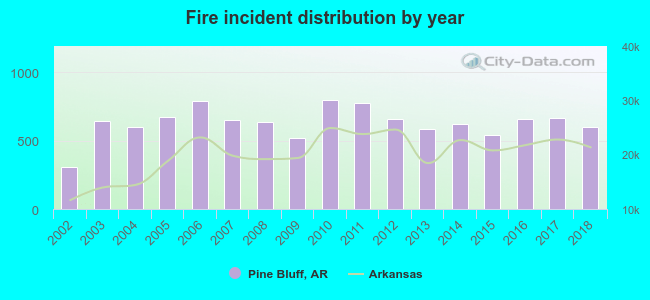 According to the data from the years 2002 - 2018 the average number of fire incidents per year is 631. The highest number of reported fires - 796 took place in 2010, and the least - 305 in 2002. The data has a rising trend.
The average number of yearly fire incidents per 10k residents in Pine Bluff, AR compared to nearest cities:
(Note: Based on data for the last 3 years, including only cities with population 5,000 and above)
| Pine Bluff: | 141.8 |
| White Hall: | 125.3 |
| East End: | 1.4 |
| Stuttgart: | 121.9 |
| Bryant: | 54.2 |
| Little Rock: | 80.1 |
| Benton: | 96.6 |
| North Little Rock: | 87.9 |
| Warren: | 121.8 |
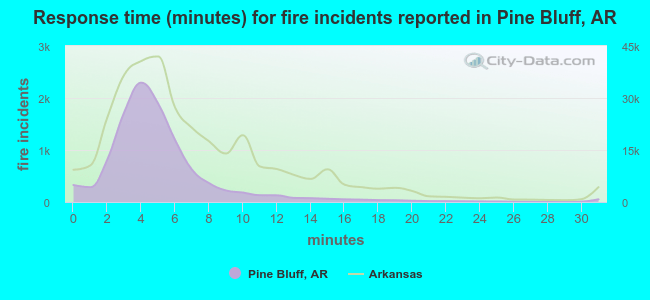 The median response time based on all reported fire incidents is 4 minutes. This is lower compared to the state median value.
The median response time in Pine Bluff, AR compared to nearest cities:
(Note: Based on data for all years, including only cities with at least 500 fire incidents)
| Pine Bluff: | 4 minutes |
| White Hall: | 8 minutes |
| Rison: | 9 minutes |
| Star City: | 12 minutes |
| Hensley: | 10 minutes |
| Sheridan: | 10 minutes |
| Stuttgart: | 4 minutes |
| Scott: | 9 minutes |
| Fordyce: | 4 minutes |
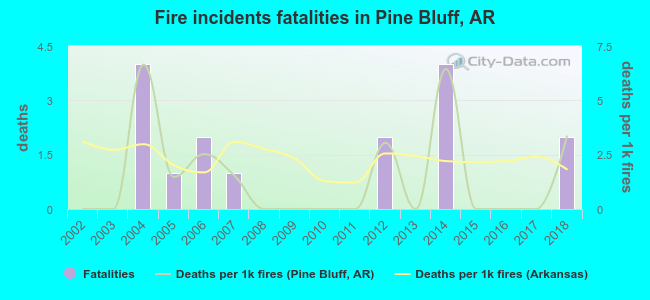 According to the data from the years 2002 - 2018 the average number of fire-related fatalities per year is 1. The highest number of reported deaths - 4 took place in 2004, and the lowest - 0 in 2002. The data has a rising trend.
The average number of deaths per 1,000 fire incidents is 1. This indicator was the highest - 7 in 2004, and the lowest 0 in 2002. The trend for fatalities per 1,000 incidents is increasing. Compared to the Arkansas value the number of deaths per 1,000 fires is lower.
According to the data from the years 2002 - 2018 the average number of fire-related fatalities per year is 1. The highest number of reported deaths - 4 took place in 2004, and the lowest - 0 in 2002. The data has a rising trend.
The average number of deaths per 1,000 fire incidents is 1. This indicator was the highest - 7 in 2004, and the lowest 0 in 2002. The trend for fatalities per 1,000 incidents is increasing. Compared to the Arkansas value the number of deaths per 1,000 fires is lower.Deaths per 1,000 incidents in Pine Bluff, AR compared to nearest cities:
(Note: Based on data for all years, including only cities with at least 2,500 fire incidents)
| Pine Bluff: | 1.5 |
| Little Rock: | 1.4 |
| Benton: | 1.2 |
| North Little Rock: | 2.3 |
| Sherwood: | 0.7 |
| Jacksonville: | 1.6 |
| Malvern: | 5.0 |
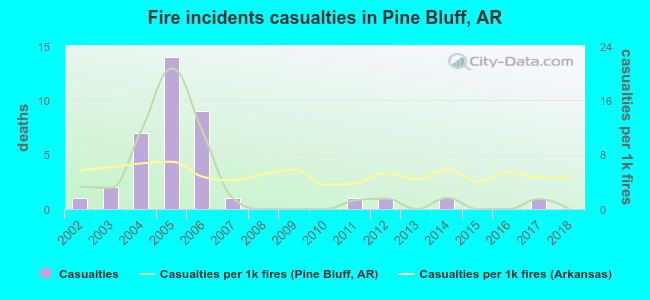 Based on the data from the years 2002 - 2018 the average number of fire-related yearly casualties is 2. The highest number of reported casualties - 14 took place in 2005, and the lowest - 0 in 2008. The data has a decreasing trend.
The average number of casualties per 1,000 fire incidents is 3. This indicator was the highest - 21 in 2005, and the lowest 0 in 2008. The trend for injuries per 1,000 fire incidents is dropping. Compared to the Arkansas value the number of casualties per 1,000 fire incidents is lower.
Based on the data from the years 2002 - 2018 the average number of fire-related yearly casualties is 2. The highest number of reported casualties - 14 took place in 2005, and the lowest - 0 in 2008. The data has a decreasing trend.
The average number of casualties per 1,000 fire incidents is 3. This indicator was the highest - 21 in 2005, and the lowest 0 in 2008. The trend for injuries per 1,000 fire incidents is dropping. Compared to the Arkansas value the number of casualties per 1,000 fire incidents is lower.
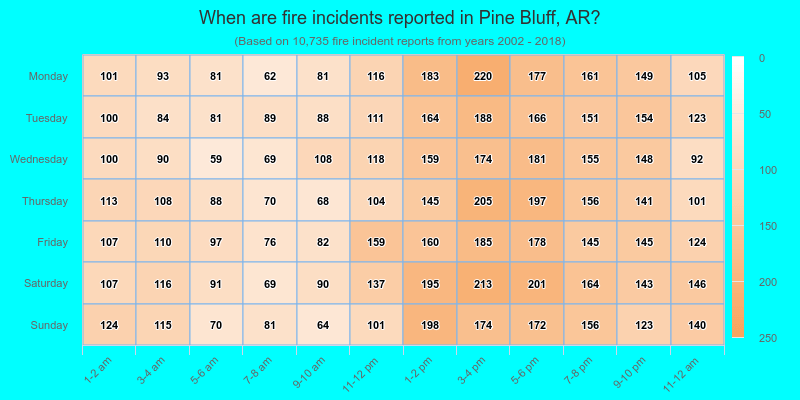
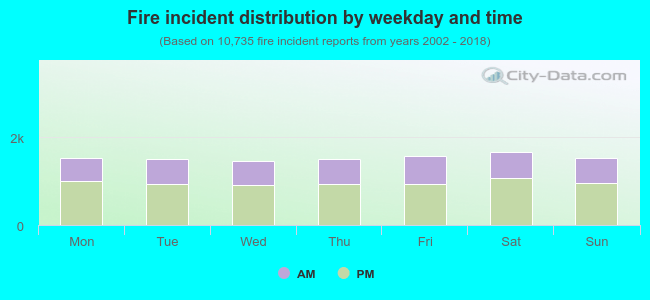 37.1% incidents where reported in the morning and 62.9% in the evening. The most fires (15.6%) took place on Saturday, and the least (13.5%) on Wednesday.
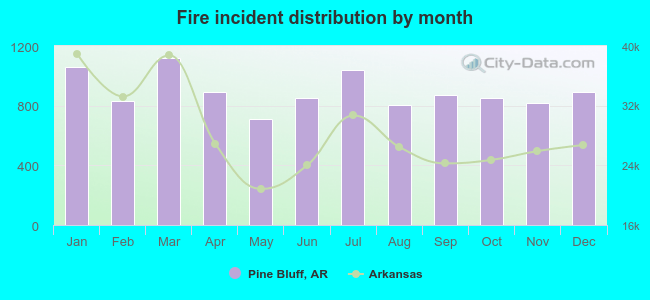 Based on the 10,735 incident reports from years 2002 - 2018 most fires (10.4%) took place during March, and the least (6.6%) in May.
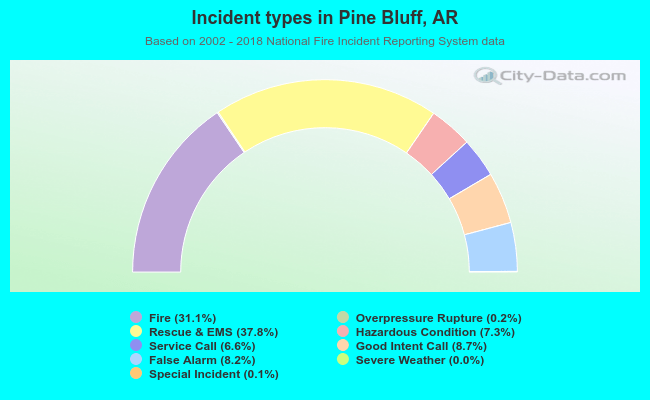 Out of all 34,548 cases reported during the years 2002 - 2018, the most belonged to the categories: Rescue & EMS (37.8%), Fire (31.1%), and Good Intent Call (8.7%).
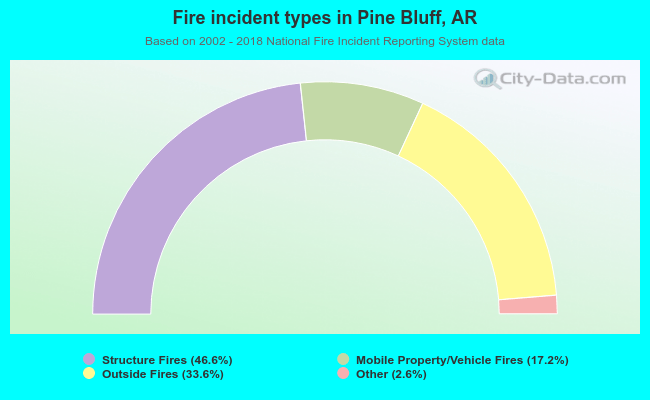 When looking into fire subcategories, the most reports belonged to: Structure Fires (46.6%), and Outside Fires (33.6%).