Peoria Heights: Fire Incidents, Illinois (IL)
Where are fire incidents reported in Peoria Heights, IL
Something went wrong! Please refresh the page.
|
| |||||||||||||||||||||||||||||||||||||||||||||||||||||||||||||||||||||||||||||||||||||||||||||||||||||||||||||
2002 - 2018 National Fire Incident Reporting System (NFIRS) incidents
- Incident types reported to NFIRS in Peoria Heights, IL
- 1,75468.1%Rescue & EMS
- 2459.5%Fire
- 1726.7%Hazardous Condition
- 1535.9%Service Call
- 1154.5%Good Intent Call
- 1154.5%False Alarm
- 100.4%Severe Weather
- 70.3%Special Incident
- 30.1%Overpressure Rupture
- Fire incident types reported to NFIRS in Peoria Heights, IL
- 11446.5%Structure Fires
- 8032.7%Outside Fires
- 4016.3%Mobile Property/Vehicle Fires
- 114.5%Other
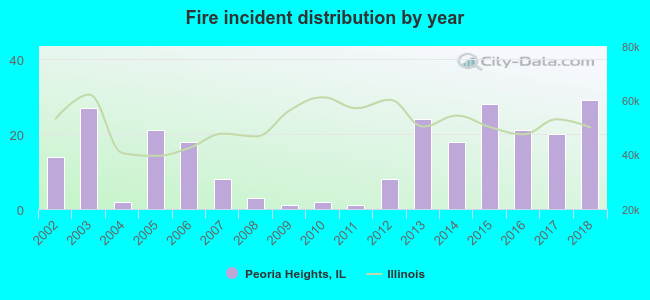 According to the data from the years 2002 - 2018 the average number of fires per year is 14. The highest number of fires - 29 took place in 2018, and the least - 1 in 2009. The data has an increasing trend.
The average number of yearly fire incidents per 10k residents in Peoria Heights, IL compared to nearest cities:
(Note: Based on data for the last 3 years, including only cities with population 5,000 and above)
| Peoria Heights: | 38.8 |
| Peoria: | 55.5 |
| East Peoria: | 31.7 |
| Creve Coeur: | 26.7 |
| Bartonville: | 21.8 |
| Washington: | 44.0 |
| Morton: | 18.6 |
| Pekin: | 53.8 |
| Chillicothe: | 113.6 |
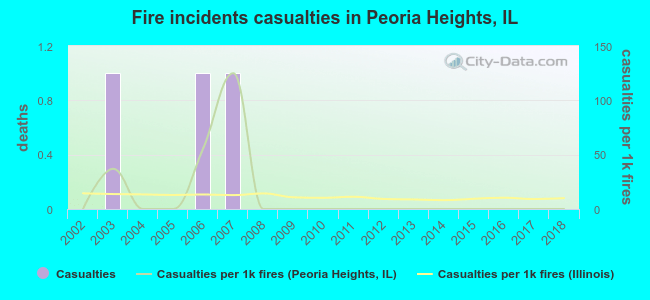 Based on the data from the years 2002 - 2018 the average number of fire-related casualties per year is 0. The highest number of casualties - 1 took place in 2003, and the lowest - 0 in 2002. The data has a constant trend.
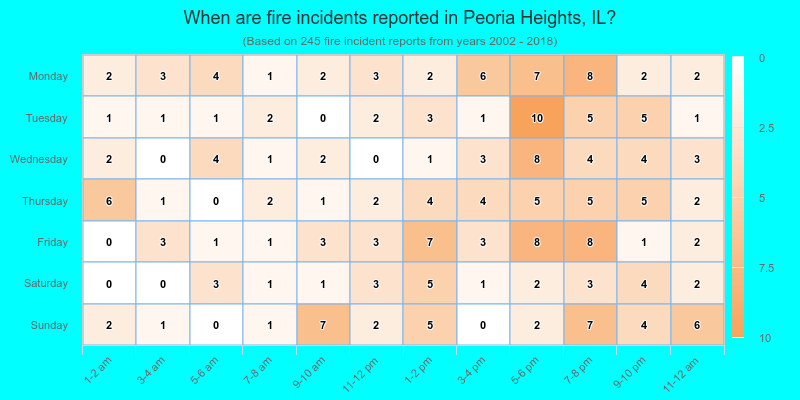
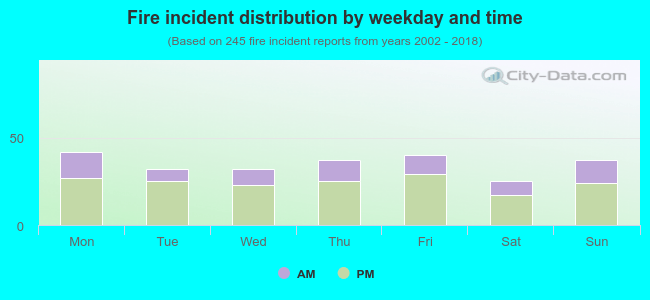 30.6% incidents where reported in the morning and 69.4% in the evening. The most fires (17.1%) took place on Monday, and the least (10.2%) on Saturday.
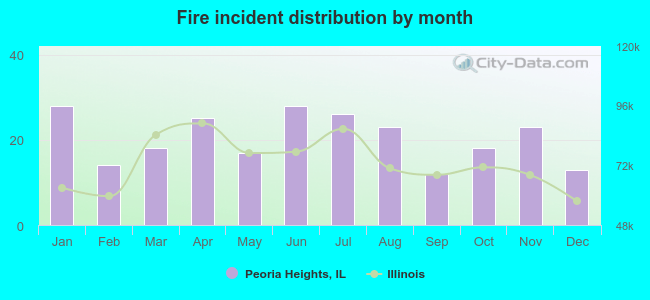 Based on the 245 incident reports from years 2002 - 2018 most fires (11.4%) took place during January, and the least (4.9%) in September.
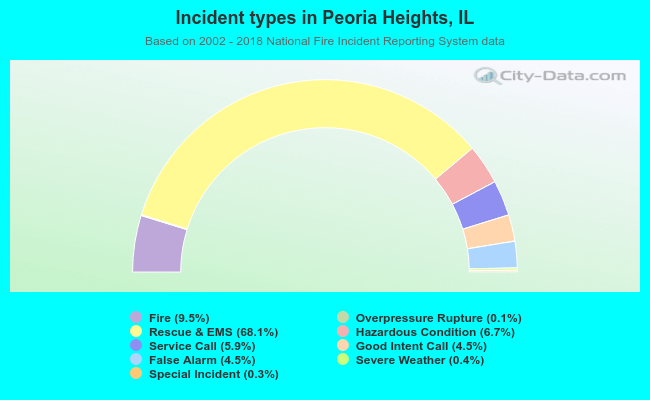 Out of all 2,574 cases reported during the years 2002 - 2018, the most belonged to the categories: Rescue & EMS (68.1%), Fire (9.5%), and Hazardous Condition (6.7%).
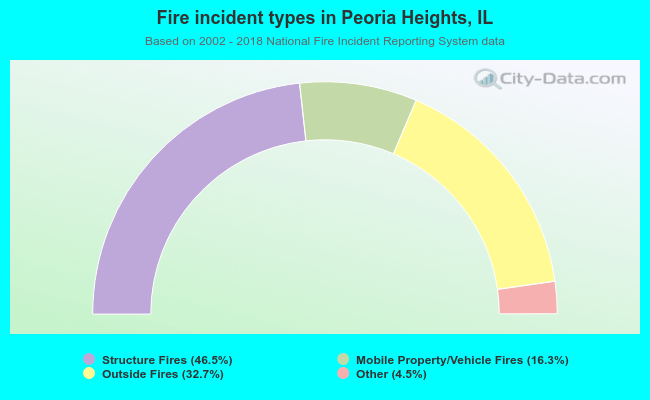 When looking into fire subcategories, the most reports belonged to: Structure Fires (46.5%), and Outside Fires (32.7%).