Pendleton: Fire Incidents, Oregon (OR)
Where are fire incidents reported in Pendleton, OR
Something went wrong! Please refresh the page.
| Fire incidents reported | |
|---|---|
| Sreet name | Count |
| COURT AVE | 128 |
| RIVERSIDE AVE | 60 |
| WESTGATE | 60 |
| 8TH ST | 46 |
| BYERS AVE | 46 |
| GOODWIN AVE | 46 |
| NYE AVE | 46 |
| SOUTHGATE | 46 |
| 28TH DR | 40 |
| 3RD ST | 40 |
| EMIGRANT AVE | 40 |
| TUTUILLA RD | 40 |
| 7TH ST | 36 |
| COURT PL | 36 |
| CARDEN AVE | 34 |
| ISAAC AVE | 34 |
| MAIN | 32 |
| MAIN ST | 32 |
| RIETH RD | 32 |
| TH ST | 32 |
| 6TH ST | 30 |
| ADAMS RD | 30 |
| DESPAIN AVE | 30 |
| DORION AVE | 30 |
| I-84 | 26 |
| 15TH ST | 24 |
| 18TH ST | 24 |
| 17TH ST | 22 |
| FRAZER AVE | 22 |
| HAILEY AVE | 22 |
| Other | 216 |
2002 - 2018 National Fire Incident Reporting System (NFIRS) incidents
- Incident types reported to NFIRS in Pendleton, OR
- 5,37165.6%Rescue & EMS
- 1,38216.9%Fire
- 5226.4%Service Call
- 3834.7%Good Intent Call
- 2663.2%False Alarm
- 2433.0%Hazardous Condition
- 120.1%Overpressure Rupture
- Fire incident types reported to NFIRS in Pendleton, OR
- 76755.5%Outside Fires
- 34725.1%Structure Fires
- 21815.8%Mobile Property/Vehicle Fires
- 503.6%Other
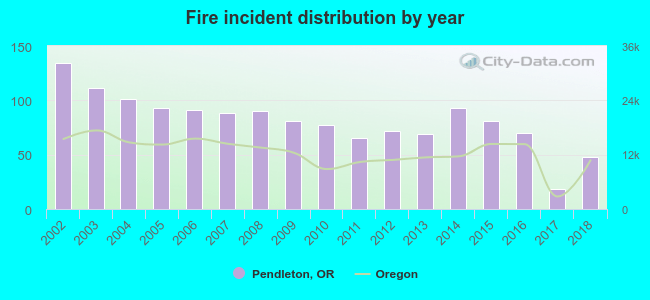 According to the data from the years 2002 - 2018 the average number of fires per year is 81. The highest number of fire incidents - 134 took place in 2002, and the least - 18 in 2017. The data has a decreasing trend.
 The median response time based on all reported fire incidents is 5 minutes. This is lower compared to the state median value.
 According to the data from the years 2002 - 2018 the average number of fire-related yearly deaths is 1. The highest number of deaths - 4 took place in 2002, and the lowest - 0 in 2003. The data has a dropping trend.
 Based on the data from the years 2002 - 2018 the average number of fire-related casualties per year is 1. The highest number of casualties - 2 took place in 2002, and the lowest - 0 in 2004. The data has a decreasing trend.
The average number of injuries per 1,000 fires is 8. This indicator was the highest - 29 in 2013, and the lowest 0 in 2004. The trend for injuries per 1,000 incidents is declining. Compared to the Oregon value the number of injuries per 1,000 fire incidents is lower.
Based on the data from the years 2002 - 2018 the average number of fire-related casualties per year is 1. The highest number of casualties - 2 took place in 2002, and the lowest - 0 in 2004. The data has a decreasing trend.
The average number of injuries per 1,000 fires is 8. This indicator was the highest - 29 in 2013, and the lowest 0 in 2004. The trend for injuries per 1,000 incidents is declining. Compared to the Oregon value the number of injuries per 1,000 fire incidents is lower.
 30.9% incidents where reported in the morning and 69.1% in the evening. The most fires (15.3%) took place on Saturday, and the least (12.4%) on Wednesday.
 Based on the 1,382 reports from years 2002 - 2018 most fires (18.1%) took place during July, and the least (3.8%) in December.
 Out of all 8,189 cases reported during the years 2002 - 2018, the most belonged to the categories: Rescue & EMS (65.6%), Fire (16.9%), and Service Call (6.4%).
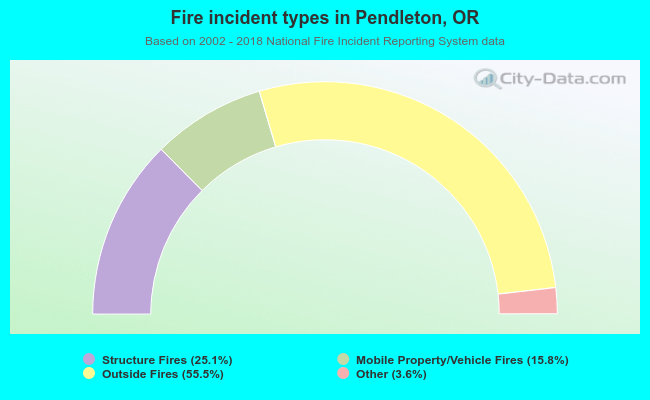 When looking into fire subcategories, the most incidents belonged to: Outside Fires (55.5%), and Structure Fires (25.1%).