Parkersburg: Fire Incidents, West Virginia (WV)
Where are fire incidents reported in Parkersburg, WV
Something went wrong! Please refresh the page.
| Fire incidents reported | |
|---|---|
| Sreet name | Count |
| MARKET ST | 242 |
| CAMDEN AVE | 140 |
| 7TH ST | 74 |
| EMERSON AVE | 70 |
| LYNN ST | 68 |
| GIHON RD | 58 |
| PIKE ST | 58 |
| 5TH ST | 56 |
| 13TH ST | 48 |
| AVERY ST | 48 |
| DUDLEY AVE | 48 |
| SPRING ST | 46 |
| 19TH ST | 44 |
| DUPONT RD | 44 |
| DIVISION ST | 42 |
| MURDOCH AVE | 42 |
| LATROBE ST | 40 |
| 31ST ST | 38 |
| LOST PAVEMENT RD | 32 |
| PLUM ST | 32 |
| 14TH ST | 30 |
| 16TH ST | 28 |
| OHIO AVE | 26 |
| 12TH ST | 24 |
| 17TH ST | 24 |
| BEAVER ST | 24 |
| BROADWAY AVE | 24 |
| CAMDEN AVE | 24 |
| GARFIELD AVE | 24 |
| WEST VIRGINIA AVE | 24 |
| Other | 1,509 |
2003 - 2018 National Fire Incident Reporting System (NFIRS) incidents
- Incident types reported to NFIRS in Parkersburg, WV
- 9,02437.6%Rescue & EMS
- 3,89416.2%Hazardous Condition
- 3,67715.3%Service Call
- 3,03112.6%Fire
- 2,64511.0%Good Intent Call
- 1,4346.0%False Alarm
- 1410.6%Overpressure Rupture
- 910.4%Severe Weather
- 330.1%Special Incident
- Fire incident types reported to NFIRS in Parkersburg, WV
- 1,52750.4%Structure Fires
- 91230.1%Outside Fires
- 45014.8%Mobile Property/Vehicle Fires
- 1424.7%Other
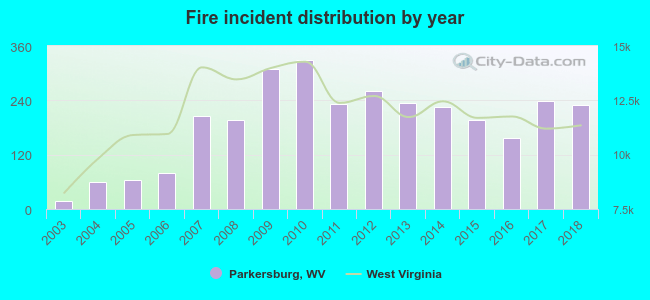 According to the data from the years 2003 - 2018 the average number of fires per year is 189. The highest number of reported fire incidents - 328 took place in 2010, and the least - 17 in 2003. The data has an increasing trend.
The average number of yearly fire incidents per 10k residents in Parkersburg, WV compared to nearest cities:
(Note: Based on data for the last 3 years, including only cities with population 5,000 and above)
| Parkersburg: | 67.1 |
| Vienna: | 26.5 |
 The median response time based on all reported fire incidents is 4 minutes. This is much lower compared to the state median value.
The median response time in Parkersburg, WV compared to nearest cities:
(Note: Based on data for all years, including only cities with at least 500 fire incidents)
| Parkersburg: | 4 minutes |
| Belpre: | 7 minutes |
| Marietta: | 4 minutes |
| Ravenswood: | 11 minutes |
| Athens: | 5 minutes |
| Pomeroy: | 8 minutes |
| Ripley: | 14 minutes |
| Glouster: | 7 minutes |
| Spencer: | 14 minutes |
 According to the reports from the years 2003 - 2018 the average number of fire-related fatalities per year is 1. The highest number of reported deaths - 4 took place in 2009, and the lowest - 0 in 2003. The data has a rising trend.
The average number of deaths per 1,000 fires is 6. This indicator was the highest - 26 in 2016, and the lowest 0 in 2003. The trend for deaths per 1,000 incidents is rising. Compared to the West Virginia value the number of deaths per 1,000 fires is higher.
According to the reports from the years 2003 - 2018 the average number of fire-related fatalities per year is 1. The highest number of reported deaths - 4 took place in 2009, and the lowest - 0 in 2003. The data has a rising trend.
The average number of deaths per 1,000 fires is 6. This indicator was the highest - 26 in 2016, and the lowest 0 in 2003. The trend for deaths per 1,000 incidents is rising. Compared to the West Virginia value the number of deaths per 1,000 fires is higher.Deaths per 1,000 incidents in Parkersburg, WV compared to nearest cities:
(Note: Based on data for all years, including only cities with at least 2,500 fire incidents)
| Parkersburg: | 6.6 |
 According to the reports from the years 2003 - 2018 the average number of fire-related yearly casualties is 3. The highest number of injuries - 7 took place in 2010, and the lowest - 0 in 2003. The data has an increasing trend.
The average number of injuries per 1,000 fires is 15. This indicator was the highest - 51 in 2004, and the lowest 0 in 2003. The trend for casualties per 1,000 incidents is growing. Compared to the state value the number of injuries per 1,000 fires is much higher.
According to the reports from the years 2003 - 2018 the average number of fire-related yearly casualties is 3. The highest number of injuries - 7 took place in 2010, and the lowest - 0 in 2003. The data has an increasing trend.
The average number of injuries per 1,000 fires is 15. This indicator was the highest - 51 in 2004, and the lowest 0 in 2003. The trend for casualties per 1,000 incidents is growing. Compared to the state value the number of injuries per 1,000 fires is much higher.
 34.6% incidents where reported in the morning and 65.4% in the evening. The most fires (15.8%) took place on Saturday, and the least (13.2%) on Thursday.
 According to the 3,031 fire incidents from years 2003 - 2018 most fires (10.4%) took place during April, and the least (6.0%) in February.
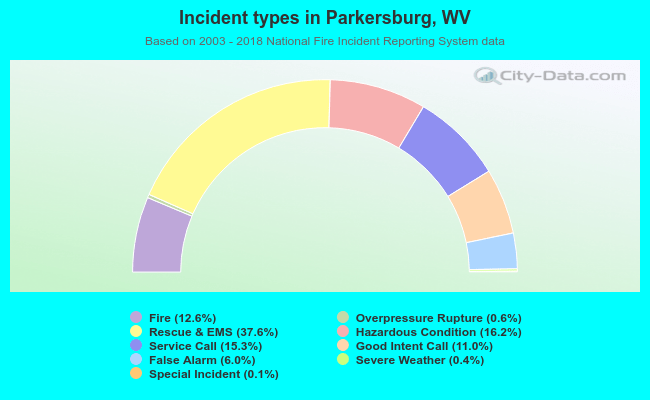 Out of all 23,970 cases reported during the years 2003 - 2018, the most belonged to the categories: Rescue & EMS (37.6%), Hazardous Condition (16.2%), and Service Call (15.3%).
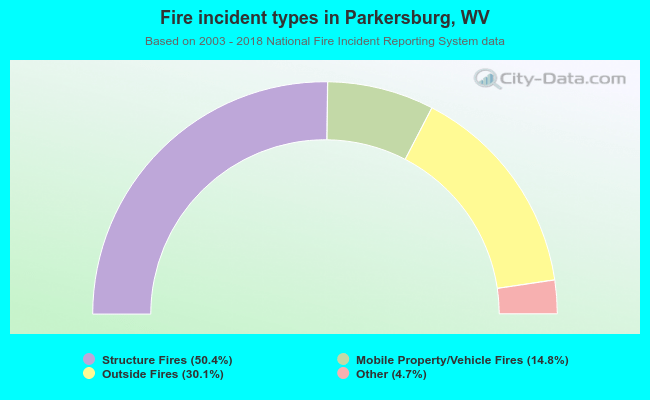 When looking into fire subcategories, the most incidents belonged to: Structure Fires (50.4%), and Outside Fires (30.1%).