Paris: Fire Incidents, Tennessee (TN)
Where are fire incidents reported in Paris, TN
Something went wrong! Please refresh the page.
| Fire incidents reported | |
|---|---|
| Sreet name | Count |
| WOOD | 52 |
| WOOD ST | 38 |
| MINERAL WELLS AVE | 32 |
| MINERAL WELLS AVE | 26 |
| HWY 77 | 24 |
| MARKET | 24 |
| MARKET ST | 24 |
| GUTHRIE RD | 22 |
| OLD MCKENZIE HWY | 22 |
| HWY 641 | 20 |
| REYNOLDSBURG RD | 20 |
| 79 HWY | 18 |
| HWY 69 | 18 |
| MEMORIAL DR | 18 |
| WYNN | 18 |
| HIGHWAY 79 N | 16 |
| HILL RD | 14 |
| HWY 54 | 14 |
| HWY 641S | 14 |
| HWY 79 S | 14 |
| MEMORIAL DR. | 14 |
| MINERAL WELLS | 14 |
| PARIS HWY 54 HWY | 14 |
| REYNOLDSBURG RD | 14 |
| BLYTHE | 12 |
| DUNLAP | 12 |
| DUNLAP ST | 12 |
| ELKHORN NOBLES RD | 12 |
| HWY 69S | 12 |
| INDIA RD | 12 |
| Other | 928 |
2002 - 2018 National Fire Incident Reporting System (NFIRS) incidents
- Incident types reported to NFIRS in Paris, TN
- 1,50439.9%Fire
- 96925.7%Hazardous Condition
- 41811.1%Good Intent Call
- 38510.2%False Alarm
- 2616.9%Rescue & EMS
- 1895.0%Service Call
- 160.4%Overpressure Rupture
- 130.3%Severe Weather
- 130.3%Special Incident
- Fire incident types reported to NFIRS in Paris, TN
- 62641.6%Structure Fires
- 52434.8%Outside Fires
- 27718.4%Mobile Property/Vehicle Fires
- 775.1%Other
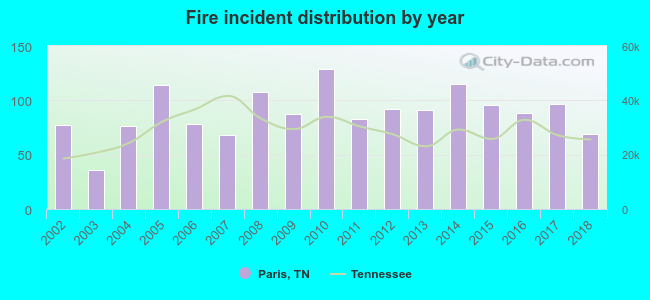 According to the data from the years 2002 - 2018 the average number of fire incidents per year is 88. The highest number of reported fires - 129 took place in 2010, and the least - 36 in 2003. The data has a dropping trend.
The average number of yearly fire incidents per 10k residents in Paris, TN compared to nearest cities:
(Note: Based on data for the last 3 years, including only cities with population 5,000 and above)
| Paris: | 83.4 |
| McKenzie: | 88.5 |
| Martin: | 58.9 |
| Milan: | 106.8 |
| Union City: | 103.1 |
| Lexington: | 127.8 |
 The median response time based on all reported fire incidents is 5 minutes. This is lower compared to the Tennessee median value.
The median response time in Paris, TN compared to nearest cities:
(Note: Based on data for all years, including only cities with at least 500 fire incidents)
| Paris: | 5 minutes |
| McKenzie: | 6 minutes |
| Huntingdon: | 7 minutes |
| Murray: | 5 minutes |
| Dresden: | 5 minutes |
| Camden: | 8 minutes |
| Martin: | 5 minutes |
| Waverly: | 11 minutes |
| Mayfield: | 5 minutes |
 According to the data from the years 2002 - 2018 the average number of fire-related fatalities per year is 0. The highest number of deaths - 3 took place in 2013, and the lowest - 0 in 2002. The data has a constant trend.
 According to the reports from the years 2002 - 2018 the average number of fire-related yearly casualties is 0. The highest number of casualties - 1 took place in 2006, and the lowest - 0 in 2002. The data has an increasing trend.
The average number of casualties per 1,000 fires is 2. This indicator was the highest - 14 in 2018, and the lowest 0 in 2002. The trend for injuries per 1,000 incidents is growing. Compared to the state value the number of injuries per 1,000 incidents is much lower.
According to the reports from the years 2002 - 2018 the average number of fire-related yearly casualties is 0. The highest number of casualties - 1 took place in 2006, and the lowest - 0 in 2002. The data has an increasing trend.
The average number of casualties per 1,000 fires is 2. This indicator was the highest - 14 in 2018, and the lowest 0 in 2002. The trend for injuries per 1,000 incidents is growing. Compared to the state value the number of injuries per 1,000 incidents is much lower.
 34.1% incidents where reported in the morning and 65.9% in the evening. The most fires (15.2%) took place on Monday, and the least (13.4%) on Sunday.
 According to the 1,504 incident reports from years 2002 - 2018 most fires (10.4%) took place during March, and the least (7.1%) in October.
 Out of all 3,768 cases reported during the years 2002 - 2018, the most belonged to the categories: Fire (39.9%), Hazardous Condition (25.7%), and Good Intent Call (11.1%).
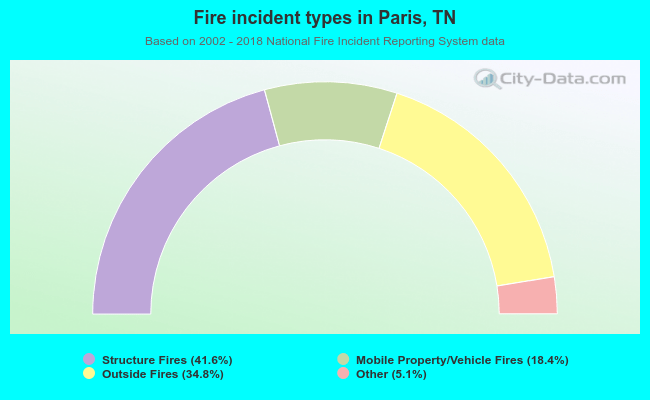 When looking into fire subcategories, the most incidents belonged to: Structure Fires (41.6%), and Outside Fires (34.8%).