Ottawa: Fire Incidents, Illinois (IL)
Where are fire incidents reported in Ottawa, IL
Something went wrong! Please refresh the page.
| Fire incidents reported | |
|---|---|
| Sreet name | Count |
| PAUL ST | 436 |
| CANAL ST | 210 |
| WASHINGTON ST | 150 |
| NORRIS DR | 138 |
| COLUMBUS ST | 126 |
| MAIN ST | 118 |
| ETNA RD | 98 |
| COLLEGE AVE | 84 |
| CENTER ST | 62 |
| LASALLE ST | 62 |
| MADISON ST | 56 |
| MCKINLEY RD | 54 |
| MARQUETTE ST | 50 |
| STEVENSON RD | 50 |
| SUPERIOR ST | 46 |
| LAFAYETTE ST | 44 |
| STATE ST | 40 |
| SECOND AVE | 36 |
| 2753RD RD | 34 |
| ADAMS ST | 34 |
| DAKOTA DR | 34 |
| ILLINOIS AVE | 34 |
| JACKSON ST | 34 |
| OTTAWA AVE | 34 |
| I-80 | 32 |
| INTERSTATE 80 | 32 |
| JEFFERSON ST | 32 |
| BOYCE MEMORIAL DR | 30 |
| CLINTON ST | 30 |
| JOLIET ST | 30 |
2002 - 2018 National Fire Incident Reporting System (NFIRS) incidents
- Incident types reported to NFIRS in Ottawa, IL
- 2,17639.5%Fire
- 1,18321.5%Rescue & EMS
- 1,02118.5%Hazardous Condition
- 84415.3%False Alarm
- 1282.3%Good Intent Call
- 961.7%Service Call
- 420.8%Overpressure Rupture
- 140.3%Severe Weather
- 90.2%Special Incident
- Fire incident types reported to NFIRS in Ottawa, IL
- 96644.4%Other
- 54725.1%Outside Fires
- 44720.5%Structure Fires
- 2169.9%Mobile Property/Vehicle Fires
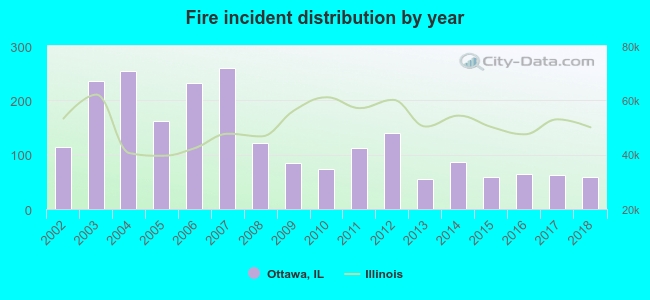 According to the data from the years 2002 - 2018 the average number of fire incidents per year is 128. The highest number of fires - 260 took place in 2007, and the least - 56 in 2013. The data has a decreasing trend.
The average number of yearly fire incidents per 10k residents in Ottawa, IL compared to nearest cities:
(Note: Based on data for the last 3 years, including only cities with population 5,000 and above)
| Ottawa: | 33.3 |
| La Salle: | 2.7 |
| Peru: | 40.9 |
| Streator: | 79.0 |
| Spring Valley: | 27.4 |
| Mendota: | 56.5 |
| Morris: | 101.4 |
| Sandwich: | 57.6 |
| Plano: | 31.3 |
 The median response time based on all reported fire incidents is 4 minutes. This is lower than the state median value.
The median response time in Ottawa, IL compared to nearest cities:
(Note: Based on data for all years, including only cities with at least 500 fire incidents)
| Ottawa: | 4 minutes |
| Marseilles: | 8 minutes |
| Peru: | 9 minutes |
| Streator: | 0 minutes |
| Mendota: | 8 minutes |
| Morris: | 9 minutes |
| Sandwich: | 8 minutes |
| Plano: | 6 minutes |
| Dwight: | 11 minutes |
 According to the reports from the years 2002 - 2018 the average number of fire-related fatalities per year is 0. The highest number of reported deaths - 2 took place in 2004, and the lowest - 0 in 2002. The data has a constant trend.
 According to the data from the years 2002 - 2018 the average number of fire-related yearly casualties is 1. The highest number of injuries - 5 took place in 2009, and the lowest - 0 in 2002. The data has a constant trend.
The average number of injuries per 1,000 fire incidents is 10. This indicator was the highest - 59 in 2009, and the lowest 0 in 2002. The trend for injuries per 1,000 incidents is constant. Compared to the Illinois value the number of casualties per 1,000 incidents is lower.
According to the data from the years 2002 - 2018 the average number of fire-related yearly casualties is 1. The highest number of injuries - 5 took place in 2009, and the lowest - 0 in 2002. The data has a constant trend.
The average number of injuries per 1,000 fire incidents is 10. This indicator was the highest - 59 in 2009, and the lowest 0 in 2002. The trend for injuries per 1,000 incidents is constant. Compared to the Illinois value the number of casualties per 1,000 incidents is lower.
 33.3% incidents where reported in the morning and 66.7% in the evening. The most fires (15.3%) took place on Wednesday, and the least (12.9%) on Tuesday.
 Based on the 2,176 fire incidents from years 2002 - 2018 most fires (11.4%) took place during April, and the least (5.1%) in December.
 Out of all 5,513 cases reported during the years 2002 - 2018, the most belonged to the categories: Fire (39.5%), Rescue & EMS (21.5%), and Hazardous Condition (18.5%).
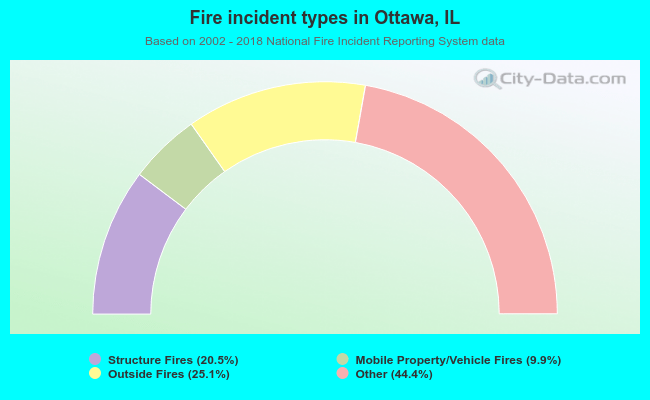 When looking into fire subcategories, the most incidents belonged to: Other (44.4%), and Outside Fires (25.1%).