Oil City: Fire Incidents, Pennsylvania (PA)
Where are fire incidents reported in Oil City, PA
Something went wrong! Please refresh the page.
| Fire incidents reported | |
|---|---|
| Sreet name | Count |
| MORAN ST | 138 |
| 2ND ST | 84 |
| BISSELL AVE | 70 |
| SENECA ST | 60 |
| 1ST ST | 50 |
| MAIN ST | 38 |
| COLBERT AVE | 36 |
| CENTRAL AVE | 34 |
| 3RD ST | 30 |
| 4TH ST | 22 |
| 6TH ST | 22 |
| VO TECH DR | 22 |
| WASHINGTON AVE | 22 |
| PLUMMER ST | 20 |
| SYCAMORE ST | 20 |
| LYNCH BLVD | 16 |
| CENTER ST | 14 |
| INNIS ST | 14 |
| GRANDVIEW RD | 12 |
| STATE ST | 12 |
| WABASH AVE | 12 |
| 7TH ST | 10 |
| HALYDAY RUN RD | 10 |
| HARRIOTT AVE | 10 |
| HOFFMAN AVE | 10 |
| HONE AVE | 10 |
| NORTH ST | 10 |
| CHARLTON ST | 8 |
| ELM ST | 8 |
| EMERALD ST | 8 |
2003 - 2018 National Fire Incident Reporting System (NFIRS) incidents
- Incident types reported to NFIRS in Oil City, PA
- 5,15756.5%Rescue & EMS
- 2,41626.5%Service Call
- 7057.7%Fire
- 3113.4%Hazardous Condition
- 2572.8%False Alarm
- 1361.5%Good Intent Call
- 1291.4%Special Incident
- 180.2%Severe Weather
- Fire incident types reported to NFIRS in Oil City, PA
- 28440.3%Other
- 22932.5%Structure Fires
- 16223.0%Outside Fires
- 304.3%Mobile Property/Vehicle Fires
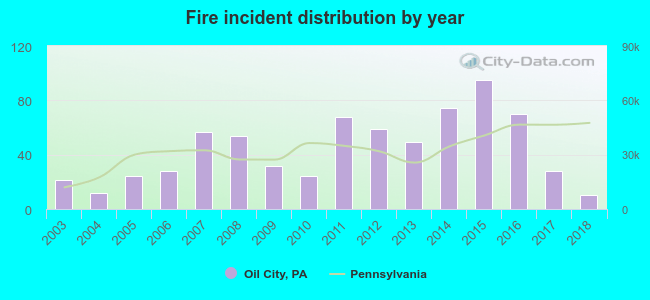 According to the data from the years 2003 - 2018 the average number of fire incidents per year is 44. The highest number of fire incidents - 95 took place in 2015, and the least - 10 in 2018. The data has a dropping trend.
The average number of yearly fire incidents per 10k residents in Oil City, PA compared to nearest cities:
(Note: Based on data for the last 3 years, including only cities with population 5,000 and above)
| Oil City: | 35.2 |
| Sugarcreek: | 7.1 |
| Franklin: | 36.2 |
| Titusville: | 66.4 |
| Grove City: | 32.1 |
| Meadville: | 117.1 |
 The median response time based on all reported fire incidents is 4 minutes. This is lower than the state median value.
The median response time in Oil City, PA compared to nearest cities:
(Note: Based on data for all years, including only cities with at least 500 fire incidents)
| Oil City: | 4 minutes |
| Franklin: | 5 minutes |
| Grove City: | 10 minutes |
| Meadville: | 6 minutes |
 According to the data from the years 2003 - 2018 the average number of fire-related fatalities per year is 0. The highest number of reported deaths - 1 took place in 2006, and the lowest - 0 in 2003. The data has a constant trend.
 Based on the reports from the years 2003 - 2018 the average number of fire-related casualties per year is 1. The highest number of reported casualties - 3 took place in 2012, and the lowest - 0 in 2003. The data has a constant trend.
The average number of casualties per 1,000 fire incidents is 12. This indicator was the highest - 83 in 2010, and the lowest 0 in 2003. The trend for casualties per 1,000 incidents is constant. Compared to the Pennsylvania value the number of casualties per 1,000 incidents is much higher.
Based on the reports from the years 2003 - 2018 the average number of fire-related casualties per year is 1. The highest number of reported casualties - 3 took place in 2012, and the lowest - 0 in 2003. The data has a constant trend.
The average number of casualties per 1,000 fire incidents is 12. This indicator was the highest - 83 in 2010, and the lowest 0 in 2003. The trend for casualties per 1,000 incidents is constant. Compared to the Pennsylvania value the number of casualties per 1,000 incidents is much higher.Casualties per 1,000 incidents in Oil City, PA compared to nearest cities:
(Note: Based on data for all years, including only cities with at least 500 fire incidents)
| Oil City: | 12.8 |
| Franklin: | 7.5 |
| Grove City: | 2.0 |
| Meadville: | 4.4 |
 32.3% incidents where reported in the morning and 67.7% in the evening. The most fires (15.7%) took place on Sunday, and the least (12.8%) on Saturday.
 Based on the 705 fire incident reports from years 2003 - 2018 most fires (13.0%) took place during April, and the least (6.5%) in November.
 Out of all 9,132 cases reported during the years 2003 - 2018, the most belonged to the categories: Rescue & EMS (56.5%), Service Call (26.5%), and Fire (7.7%).
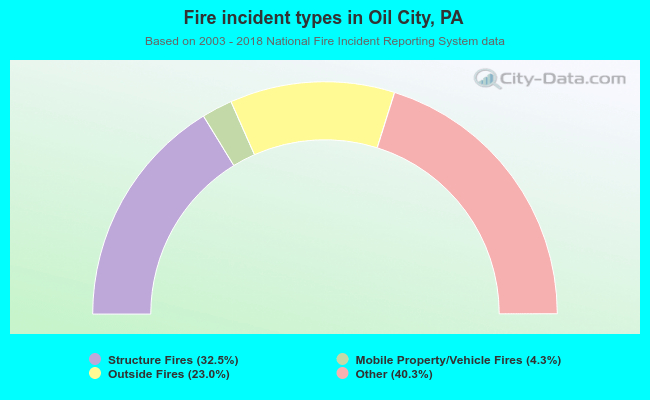 When looking into fire subcategories, the most incidents belonged to: Other (40.3%), and Structure Fires (32.5%).