North Platte: Fire Incidents, Nebraska (NE)
Where are fire incidents reported in North Platte, NE
Something went wrong! Please refresh the page.
| Fire incidents reported | |
|---|---|
| Sreet name | Count |
| 4TH ST | 114 |
| JEFFERS ST | 106 |
| 5TH ST | 100 |
| 6TH ST | 96 |
| DEWEY ST | 86 |
| PHILIP AVE | 86 |
| RODEO RD | 74 |
| 9TH ST | 72 |
| 2ND ST | 68 |
| 10TH ST | 56 |
| 14TH ST | 54 |
| FRONT ST | 54 |
| 12TH ST | 52 |
| 3RD ST | 48 |
| HWY 83 | 48 |
| 11TH ST | 46 |
| BUFFALO BILL AVE | 46 |
| E ST | 46 |
| HWY 30 | 40 |
| A ST | 38 |
| LEOTA ST | 38 |
| RIVER RD | 38 |
| 8TH ST | 32 |
| 13TH ST | 30 |
| NORTH RIVER RD | 28 |
| AUTUMN PARK DR | 26 |
| OAK ST | 26 |
| WALKER RD | 26 |
| D ST | 24 |
| HIGHWAY 30 | 24 |
| Other | 337 |
2002 - 2018 National Fire Incident Reporting System (NFIRS) incidents
- Incident types reported to NFIRS in North Platte, NE
- 3,32144.2%Rescue & EMS
- 1,95926.1%Fire
- 93912.5%Hazardous Condition
- 5247.0%False Alarm
- 4726.3%Good Intent Call
- 2543.4%Service Call
- 190.3%Special Incident
- 90.1%Overpressure Rupture
- 90.1%Severe Weather
- Fire incident types reported to NFIRS in North Platte, NE
- 1,04953.5%Outside Fires
- 44122.5%Structure Fires
- 31015.8%Mobile Property/Vehicle Fires
- 1598.1%Other
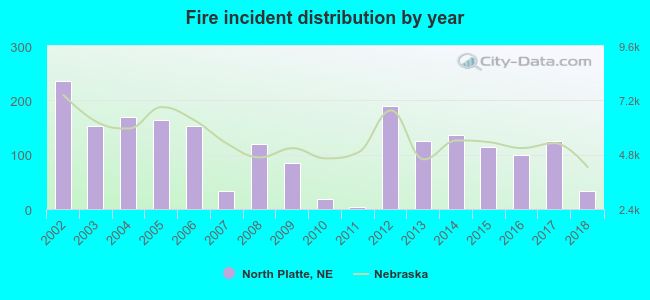 According to the data from the years 2002 - 2018 the average number of fires per year is 115. The highest number of fire incidents - 236 took place in 2002, and the least - 4 in 2011. The data has a decreasing trend.
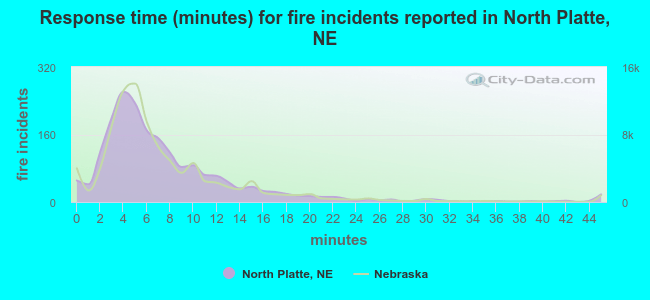 The median response time based on all reported fire incidents is 6 minutes. This is comparable to the Nebraska median value.
The median response time in North Platte, NE compared to nearest cities:
(Note: Based on data for all years, including only cities with at least 500 fire incidents)
| North Platte: | 6 minutes |
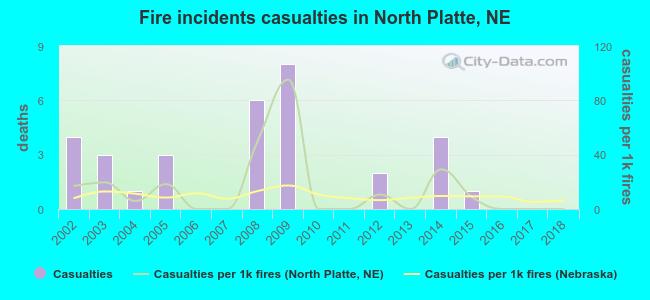 According to the reports from the years 2002 - 2018 the average number of fire-related casualties per year is 2. The highest number of reported casualties - 8 took place in 2009, and the lowest - 0 in 2006. The data has a dropping trend.
The average number of injuries per 1,000 fire incidents is 15. This indicator was the highest - 95 in 2009, and the lowest 0 in 2006. The trend for injuries per 1,000 fire incidents is declining. Compared to the state value the number of injuries per 1,000 fires is higher.
According to the reports from the years 2002 - 2018 the average number of fire-related casualties per year is 2. The highest number of reported casualties - 8 took place in 2009, and the lowest - 0 in 2006. The data has a dropping trend.
The average number of injuries per 1,000 fire incidents is 15. This indicator was the highest - 95 in 2009, and the lowest 0 in 2006. The trend for injuries per 1,000 fire incidents is declining. Compared to the state value the number of injuries per 1,000 fires is higher.Casualties per 1,000 incidents in North Platte, NE compared to nearest cities:
(Note: Based on data for all years, including only cities with at least 500 fire incidents)
| North Platte: | 16.3 |
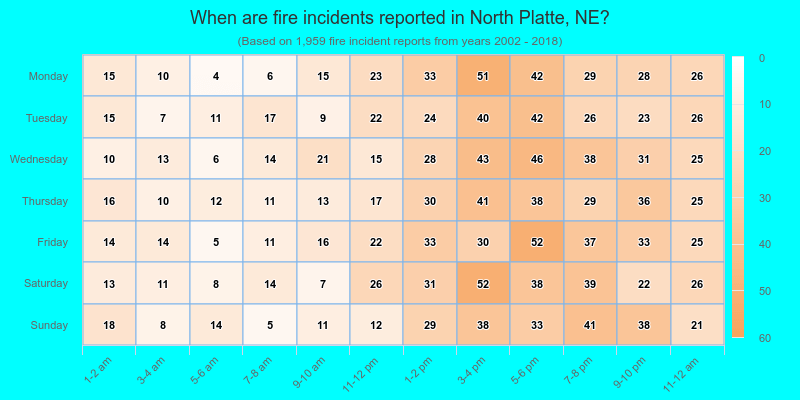
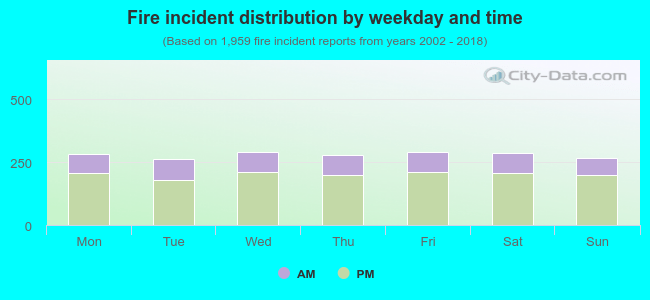 27.6% incidents where reported in the morning and 72.4% in the evening. The most fires (14.9%) took place on Friday, and the least (13.4%) on Tuesday.
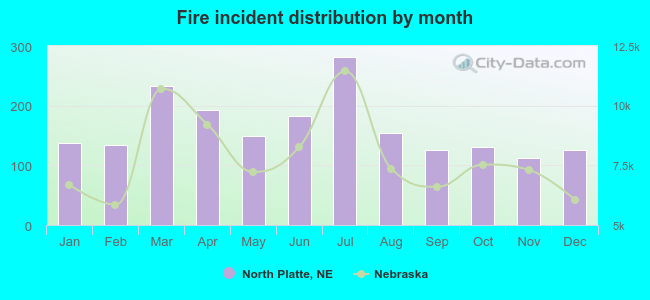 According to the 1,959 fire incident reports from years 2002 - 2018 most fires (14.4%) took place during July, and the least (5.8%) in November.
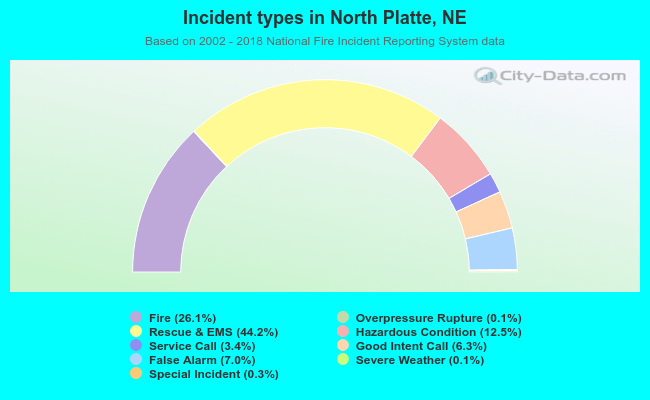 Out of all 7,506 cases reported during the years 2002 - 2018, the most belonged to the categories: Rescue & EMS (44.2%), Fire (26.1%), and Hazardous Condition (12.5%).
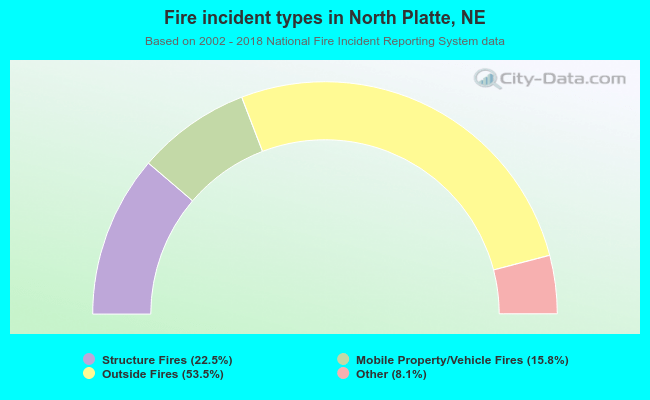 When looking into fire subcategories, the most reports belonged to: Outside Fires (53.5%), and Structure Fires (22.5%).