North Plainfield: Fire Incidents, New Jersey (NJ)
Where are fire incidents reported in North Plainfield, NJ
Something went wrong! Please refresh the page.
| Fire incidents reported | |
|---|---|
| Sreet name | Count |
| ROUTE 22 HWY | 218 |
| SOMERSET ST | 146 |
| GROVE ST | 66 |
| ROCK AVE | 62 |
| DUER ST | 46 |
| GREENBROOK RD | 46 |
| WATCHUNG AVE | 46 |
| MAPLE AVE | 40 |
| MOUNTAIN AVE | 40 |
| MANNING AVE | 38 |
| WILSON AVE | 32 |
| WEST END AVE | 30 |
| BROOK AVE | 26 |
| WESTERVELT AVE | 26 |
| ROCKVIEW AVE | 24 |
| WILLOW AVE | 24 |
| FAIRVIEW AVE | 22 |
| GRANDVIEW AVE | 20 |
| SANDFORD AVE | 18 |
| SUMMIT AVE | 18 |
| JACKSON AVE | 16 |
| NORTH DR | 16 |
| LINDEN AVE | 14 |
| MYRTLE AVE | 14 |
| PEARL ST | 14 |
| STONE ST | 14 |
| HARRISON AVE | 12 |
| LINCOLN PL | 12 |
| NORWOOD AVE | 12 |
| REGENT ST | 12 |
2003 - 2018 National Fire Incident Reporting System (NFIRS) incidents
- Incident types reported to NFIRS in North Plainfield, NJ
- 6,53555.8%Rescue & EMS
- 2,08917.8%Hazardous Condition
- 8157.0%Fire
- 7706.6%Good Intent Call
- 7586.5%False Alarm
- 6875.9%Service Call
- 420.4%Overpressure Rupture
- Fire incident types reported to NFIRS in North Plainfield, NJ
- 45756.1%Structure Fires
- 23528.8%Outside Fires
- 12014.7%Mobile Property/Vehicle Fires
- 30.4%Other
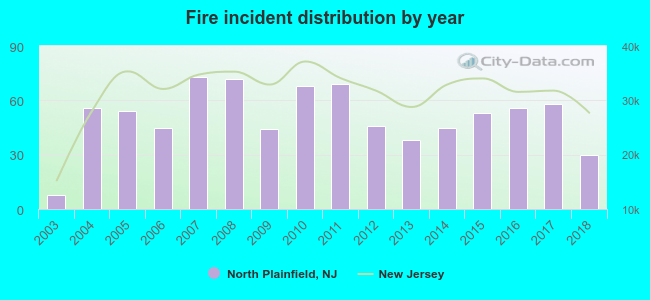 According to the data from the years 2003 - 2018 the average number of fire incidents per year is 51. The highest number of fires - 73 took place in 2007, and the least - 8 in 2003. The data has a rising trend.
The average number of yearly fire incidents per 10k residents in North Plainfield, NJ compared to nearest cities:
(Note: Based on data for the last 3 years, including only cities with population 5,000 and above)
| North Plainfield: | 21.8 |
| Plainfield: | 25.8 |
| Watchung: | 19.9 |
| Dunellen: | 9.0 |
| Fanwood: | 9.6 |
| South Plainfield: | 48.3 |
| Scotch Plains: | 31.4 |
| Berkeley Heights: | 30.8 |
| Middlesex: | 2.9 |
 The median response time based on all reported fire incidents is 5 minutes. This is close to the New Jersey median value.
The median response time in North Plainfield, NJ compared to nearest cities:
(Note: Based on data for all years, including only cities with at least 500 fire incidents)
| North Plainfield: | 5 minutes |
| Plainfield: | 5 minutes |
| South Plainfield: | 4 minutes |
| Scotch Plains: | 6 minutes |
| Berkeley Heights: | 5 minutes |
| Westfield: | 3 minutes |
| Clark: | 6 minutes |
| Colonia: | 5 minutes |
| Iselin: | 5 minutes |
 According to the reports from the years 2003 - 2018 the average number of fire-related fatalities per year is 0. The highest number of deaths - 1 took place in 2004, and the lowest - 0 in 2003. The data has a constant trend.
 According to the data from the years 2003 - 2018 the average number of fire-related yearly casualties is 2. The highest number of casualties - 6 took place in 2009, and the lowest - 0 in 2016. The data has a decreasing trend.
The average number of injuries per 1,000 fires is 38. This indicator was the highest - 136 in 2009, and the lowest 0 in 2016. The trend for injuries per 1,000 fires is dropping. Compared to the state value the number of casualties per 1,000 fires is much higher.
According to the data from the years 2003 - 2018 the average number of fire-related yearly casualties is 2. The highest number of casualties - 6 took place in 2009, and the lowest - 0 in 2016. The data has a decreasing trend.
The average number of injuries per 1,000 fires is 38. This indicator was the highest - 136 in 2009, and the lowest 0 in 2016. The trend for injuries per 1,000 fires is dropping. Compared to the state value the number of casualties per 1,000 fires is much higher.Casualties per 1,000 incidents in North Plainfield, NJ compared to nearest cities:
(Note: Based on data for all years, including only cities with at least 500 fire incidents)
| North Plainfield: | 31.9 |
| Plainfield: | 16.7 |
| South Plainfield: | 21.8 |
| Scotch Plains: | 4.8 |
| Berkeley Heights: | 19.2 |
| Westfield: | 9.8 |
| Clark: | 14.5 |
| Colonia: | 5.7 |
| Iselin: | 5.1 |
 30.8% incidents where reported in the morning and 69.2% in the evening. The most fires (15.2%) took place on Friday, and the least (12.5%) on Saturday.
 Based on the 815 fire incidents from years 2003 - 2018 most fires (12.0%) took place during April, and the least (6.1%) in February.
 Out of all 11,707 cases reported during the years 2003 - 2018, the most belonged to the categories: Rescue & EMS (55.8%), Hazardous Condition (17.8%), and Fire (7.0%).
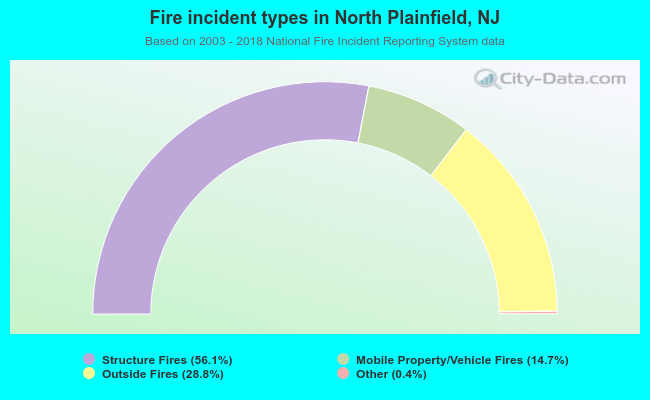 When looking into fire subcategories, the most incidents belonged to: Structure Fires (56.1%), and Outside Fires (28.8%).