Naperville: Fire Incidents, Illinois (IL)
Where are fire incidents reported in Naperville, IL
Something went wrong! Please refresh the page.
| Fire incidents reported | |
|---|---|
| Sreet name | Count |
| ROUTE 59 | 326 |
| OGDEN AVE | 164 |
| OGDEN AV | 142 |
| WASHINGTON ST | 140 |
| FAIRWAY DR | 134 |
| DIEHL RD | 108 |
| 75TH ST | 104 |
| ROYAL ST GEORGE DR | 94 |
| I-88 EXPY | 82 |
| AURORA AVE | 80 |
| BROOKDALE RD | 76 |
| 95TH ST | 70 |
| BAILEY RD | 68 |
| BENEDETTI DR | 66 |
| NAPER BLVD | 62 |
| INLAND CR | 60 |
| OGDEN | 58 |
| JEFFERSON AVE | 52 |
| 87TH ST | 50 |
| AURORA AV | 50 |
| MILL ST | 50 |
| MODAFF RD | 50 |
| NORTH AURORA RD | 50 |
| SHOWPLACE DR | 50 |
| LOOMIS ST | 46 |
| NAPER BL | 44 |
| RAYMOND DR | 44 |
| 111TH ST | 40 |
| SCHOGER RD | 40 |
| FREEDOM DR | 38 |
| Other | 1,690 |
2002 - 2018 National Fire Incident Reporting System (NFIRS) incidents
- Incident types reported to NFIRS in Naperville, IL
- 44,44253.3%Rescue & EMS
- 16,56419.9%False Alarm
- 8,1589.8%Service Call
- 6,8968.3%Hazardous Condition
- 4,1285.0%Fire
- 2,9133.5%Good Intent Call
- Fire incident types reported to NFIRS in Naperville, IL
- 1,79143.4%Outside Fires
- 1,63939.7%Structure Fires
- 60014.5%Mobile Property/Vehicle Fires
- 982.4%Other
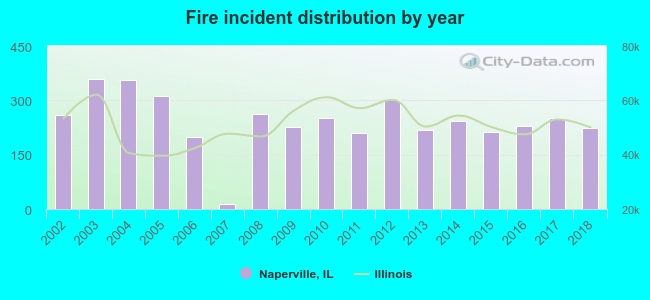 According to the data from the years 2002 - 2018 the average number of fires per year is 243. The highest number of reported fires - 359 took place in 2003, and the least - 14 in 2007. The data has a dropping trend.
The average number of yearly fire incidents per 10k residents in Naperville, IL compared to nearest cities:
(Note: Based on data for the last 3 years, including only cities with population 5,000 and above)
| Naperville: | 16.1 |
| Lisle: | 29.1 |
| Bolingbrook: | 23.8 |
| Warrenville: | 33.7 |
| Woodridge: | 20.6 |
| Aurora: | 11.7 |
| Downers Grove: | 20.0 |
| Wheaton: | 18.3 |
| Romeoville: | 31.3 |
 The median response time based on all reported fire incidents is 5 minutes. This is comparable to the Illinois median value.
The median response time in Naperville, IL compared to nearest cities:
(Note: Based on data for all years, including only cities with at least 500 fire incidents)
| Naperville: | 5 minutes |
| Lisle: | 5 minutes |
| Bolingbrook: | 5 minutes |
| Warrenville: | 5 minutes |
| Woodridge: | 5 minutes |
| Aurora: | 5 minutes |
| Downers Grove: | 5 minutes |
| Wheaton: | 5 minutes |
| Romeoville: | 5 minutes |
 Based on the reports from the years 2002 - 2018 the average number of fire-related yearly deaths is 0. The highest number of reported deaths - 2 took place in 2013, and the lowest - 0 in 2002. The data has a constant trend.
The average number of fatalities per 1,000 fire incidents is 1. This indicator was the highest - 9 in 2013, and the lowest 0 in 2002. The trend for fatalities per 1,000 incidents is constant. Compared to the state value the number of fatalities per 1,000 incidents is much lower.
Based on the reports from the years 2002 - 2018 the average number of fire-related yearly deaths is 0. The highest number of reported deaths - 2 took place in 2013, and the lowest - 0 in 2002. The data has a constant trend.
The average number of fatalities per 1,000 fire incidents is 1. This indicator was the highest - 9 in 2013, and the lowest 0 in 2002. The trend for fatalities per 1,000 incidents is constant. Compared to the state value the number of fatalities per 1,000 incidents is much lower.Deaths per 1,000 incidents in Naperville, IL compared to nearest cities:
(Note: Based on data for all years, including only cities with at least 2,500 fire incidents)
| Naperville: | 1.0 |
| Bolingbrook: | 1.0 |
| Aurora: | 4.4 |
| Plainfield: | 1.2 |
| Addison: | 1.6 |
| Joliet: | 2.2 |
 According to the data from the years 2002 - 2018 the average number of fire-related yearly casualties is 6. The highest number of casualties - 10 took place in 2013, and the lowest - 0 in 2007. The data has a growing trend.
The average number of casualties per 1,000 fire incidents is 23. This indicator was the highest - 46 in 2013, and the lowest 0 in 2007. The trend for casualties per 1,000 fire incidents is rising. Compared to the Illinois value the number of casualties per 1,000 fire incidents is much higher.
According to the data from the years 2002 - 2018 the average number of fire-related yearly casualties is 6. The highest number of casualties - 10 took place in 2013, and the lowest - 0 in 2007. The data has a growing trend.
The average number of casualties per 1,000 fire incidents is 23. This indicator was the highest - 46 in 2013, and the lowest 0 in 2007. The trend for casualties per 1,000 fire incidents is rising. Compared to the Illinois value the number of casualties per 1,000 fire incidents is much higher.Casualties per 1,000 incidents in Naperville, IL compared to nearest cities:
(Note: Based on data for all years, including only cities with at least 500 fire incidents)
| Naperville: | 23.5 |
| Lisle: | 26.1 |
| Bolingbrook: | 20.8 |
| Warrenville: | 33.4 |
| Woodridge: | 19.9 |
| Aurora: | 14.2 |
| Downers Grove: | 21.9 |
| Wheaton: | 12.6 |
| Romeoville: | 12.2 |
 29.6% incidents where reported in the morning and 70.4% in the evening. The most fires (15.6%) took place on Sunday, and the least (13.8%) on Wednesday.
 Based on the 4,128 fire incidents from years 2002 - 2018 most fires (13.3%) took place during July, and the least (5.3%) in February.
 Out of all 83,313 cases reported during the years 2002 - 2018, the most belonged to the categories: Rescue & EMS (53.3%), False Alarm (19.9%), and Service Call (9.8%).
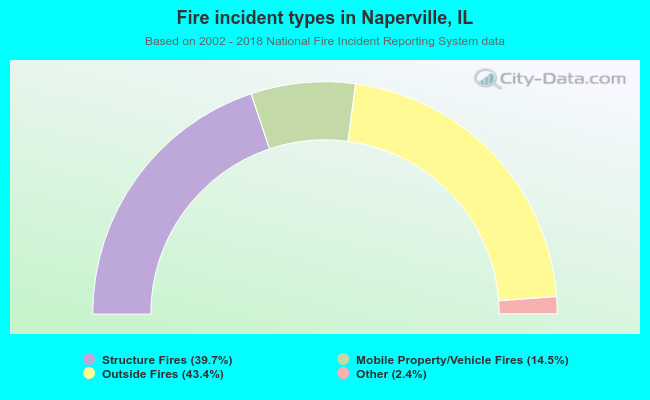 When looking into fire subcategories, the most reports belonged to: Outside Fires (43.4%), and Structure Fires (39.7%).