Murrayville: Fire Incidents, Georgia (GA)
Where are fire incidents reported in Murrayville, GA
Something went wrong! Please refresh the page.
|
| |||||||||||||||||||||||||||||||||||||||||||||||||||||||||||||||||||||||||||||||||||||||||||||||||||||||||||||
2005 - 2018 National Fire Incident Reporting System (NFIRS) incidents
- Incident types reported to NFIRS in Murrayville, GA
- 1,77464.8%Rescue & EMS
- 29810.9%Fire
- 2629.6%Good Intent Call
- 2408.8%Service Call
- 1174.3%Hazardous Condition
- 431.6%False Alarm
- 30.1%Overpressure Rupture
- Fire incident types reported to NFIRS in Murrayville, GA
- 12843.0%Outside Fires
- 12240.9%Structure Fires
- 4615.4%Mobile Property/Vehicle Fires
- 20.7%Other
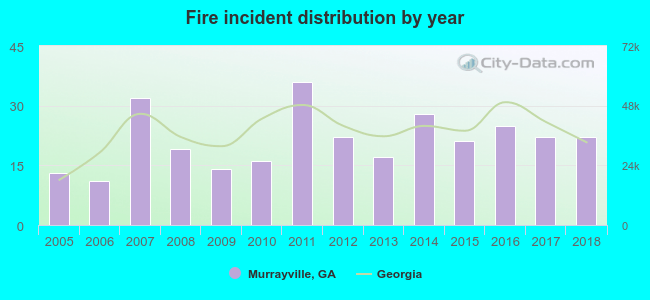 According to the data from the years 2005 - 2018 the average number of fires per year is 21. The highest number of fires - 36 took place in 2011, and the least - 11 in 2006. The data has an increasing trend.
The average number of yearly fire incidents per 10k residents in Murrayville, GA compared to nearest cities:
(Note: Based on data for the last 3 years, including only cities with population 5,000 and above)
| Murrayville: | 14.2 |
| Gainesville: | 129.7 |
| Dahlonega: | 165.7 |
| Flowery Branch: | 122.7 |
| Cumming: | 582.4 |
| Buford: | 165.8 |
| Sugar Hill: | 0.5 |
| Braselton: | 46.2 |
| Suwanee: | 63.1 |

 According to the data from the years 2005 - 2018 the average number of fire-related yearly casualties is 0. The highest number of casualties - 4 took place in 2010, and the lowest - 0 in 2005. The data has a constant trend.
 24.2% incidents where reported in the morning and 75.8% in the evening. The most fires (17.8%) took place on Sunday, and the least (11.1%) on Thursday.
 Based on the 298 fires from years 2005 - 2018 most fires (16.1%) took place during March, and the least (4.0%) in July.
 Out of all 2,738 cases reported during the years 2005 - 2018, the most belonged to the categories: Rescue & EMS (64.8%), Fire (10.9%), and Good Intent Call (9.6%).
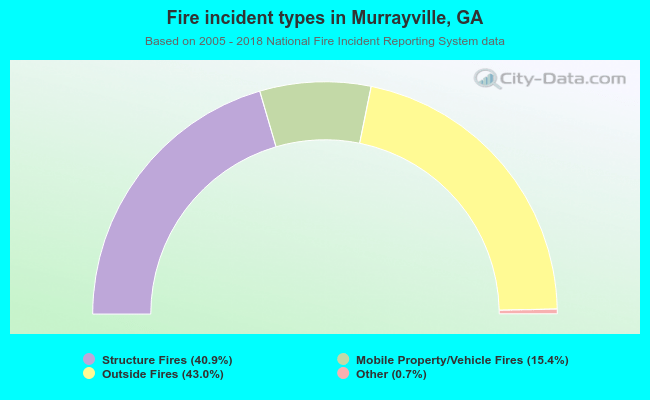 When looking into fire subcategories, the most incidents belonged to: Outside Fires (43.0%), and Structure Fires (40.9%).