Montclair: Fire Incidents, California (CA)
Where are fire incidents reported in Montclair, CA
Something went wrong! Please refresh the page.
| Fire incidents reported | |
|---|---|
| Sreet name | Count |
| CENTRAL AVE | 122 |
| HOLT BLVD | 118 |
| CANOGA ST | 80 |
| MISSION BLVD | 70 |
| BANDERA ST | 66 |
| RAMONA AVE | 62 |
| MONTE VISTA AVE | 56 |
| ARROW HWY | 52 |
| KINGSLEY ST | 50 |
| ORCHARD ST | 48 |
| STATE ST | 46 |
| BROOKS ST | 44 |
| SAN JOSE ST | 40 |
| MORENO ST | 38 |
| SAN BERNARDINO ST | 32 |
| FREMONT AVE | 30 |
| MONTE VISTA AV | 30 |
| BENITO ST | 28 |
| BENSON AVE | 28 |
| HOLT BL | 28 |
| CENTRAL AV | 26 |
| MISSION BL | 24 |
| RICHTON ST | 24 |
| MILLS AVE | 22 |
| HOWARD ST | 20 |
| ROSEWOOD ST | 20 |
| MONTCLAIR PLAZA LN | 18 |
| PRADERA AVE | 18 |
| VERNON AVE | 18 |
| FREMONT AV | 16 |
2005 - 2017 National Fire Incident Reporting System (NFIRS) incidents
- Incident types reported to NFIRS in Montclair, CA
- 3,30247.9%Rescue & EMS
- 1,40120.3%Good Intent Call
- 1,01214.7%Fire
- 5407.8%Hazardous Condition
- 3304.8%Service Call
- 2994.3%False Alarm
- Fire incident types reported to NFIRS in Montclair, CA
- 39939.4%Outside Fires
- 37637.2%Structure Fires
- 22422.1%Mobile Property/Vehicle Fires
- 131.3%Other
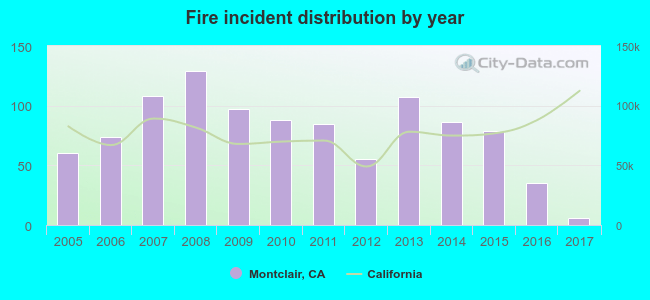 Based on the data from the years 2005 - 2017 the average number of fires per year is 78. The highest number of fires - 129 took place in 2008, and the least - 6 in 2017. The data has a declining trend.
The average number of yearly fire incidents per 10k residents in Montclair, CA compared to nearest cities:
(Note: Based on data for the last 3 years, including only cities with population 5,000 and above)
| Montclair: | 3.8 |
| Claremont: | 16.7 |
| Pomona: | 27.8 |
| Upland: | 6.6 |
| Chino: | 11.2 |
| Ontario: | 9.3 |
| La Verne: | 17.0 |
| Chino Hills: | 5.7 |
| San Dimas: | 14.6 |
 The median response time based on all reported fire incidents is 6 minutes. This is about the same as the state median value.
The median response time in Montclair, CA compared to nearest cities:
(Note: Based on data for all years, including only cities with at least 500 fire incidents)
| Montclair: | 6 minutes |
| Claremont: | 5 minutes |
| Pomona: | 5 minutes |
| Chino: | 6 minutes |
| Ontario: | 6 minutes |
| La Verne: | 5 minutes |
| San Dimas: | 5 minutes |
| Rancho Cucamonga: | 7 minutes |
| Diamond Bar: | 6 minutes |
 Based on the reports from the years 2005 - 2017 the average number of fire-related casualties per year is 1. The highest number of casualties - 4 took place in 2011, and the lowest - 0 in 2008. The data has a declining trend.
The average number of injuries per 1,000 fire incidents is 15. This indicator was the highest - 47 in 2011, and the lowest 0 in 2008. The trend for injuries per 1,000 fire incidents is decreasing. Compared to the state value the number of injuries per 1,000 incidents is much higher.
Based on the reports from the years 2005 - 2017 the average number of fire-related casualties per year is 1. The highest number of casualties - 4 took place in 2011, and the lowest - 0 in 2008. The data has a declining trend.
The average number of injuries per 1,000 fire incidents is 15. This indicator was the highest - 47 in 2011, and the lowest 0 in 2008. The trend for injuries per 1,000 fire incidents is decreasing. Compared to the state value the number of injuries per 1,000 incidents is much higher.Casualties per 1,000 incidents in Montclair, CA compared to nearest cities:
(Note: Based on data for all years, including only cities with at least 500 fire incidents)
| Montclair: | 16.8 |
| Claremont: | 0.0 |
| Pomona: | 0.2 |
| Chino: | 0.0 |
| Ontario: | 14.5 |
| La Verne: | 31.6 |
| San Dimas: | 0.0 |
| Rancho Cucamonga: | 15.6 |
| Diamond Bar: | 0.0 |
 34.9% incidents where reported in the morning and 65.1% in the evening. The most fires (17.5%) took place on Monday, and the least (12.2%) on Thursday.
 Based on the 1,012 incident reports from years 2005 - 2017 most fires (11.5%) took place during January, and the least (5.8%) in November.
 Out of all 6,891 cases reported during the years 2005 - 2017, the most belonged to the categories: Rescue & EMS (47.9%), Good Intent Call (20.3%), and Fire (14.7%).
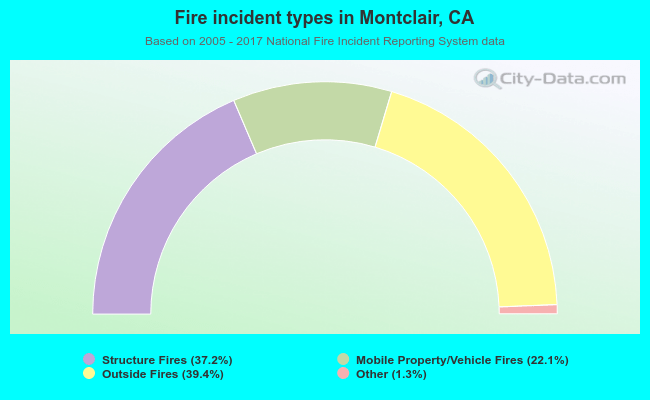 When looking into fire subcategories, the most incidents belonged to: Outside Fires (39.4%), and Structure Fires (37.2%).