Monessen: Fire Incidents, Pennsylvania (PA)
Where are fire incidents reported in Monessen, PA
Something went wrong! Please refresh the page.
|
| |||||||||||||||||||||||||||||||||||||||||||||||||||||||||||||||||||||||||||||||||||||||||||||||||||||||||||||
2005 - 2018 National Fire Incident Reporting System (NFIRS) incidents
- Incident types reported to NFIRS in Monessen, PA
- 14927.1%Good Intent Call
- 13925.3%Fire
- 7714.0%Hazardous Condition
- 7112.9%Service Call
- 6211.3%Rescue & EMS
- 427.7%False Alarm
- 30.5%Overpressure Rupture
- 30.5%Severe Weather
- 30.5%Special Incident
- Fire incident types reported to NFIRS in Monessen, PA
- 9366.9%Structure Fires
- 2618.7%Other
- 117.9%Mobile Property/Vehicle Fires
- 96.5%Outside Fires
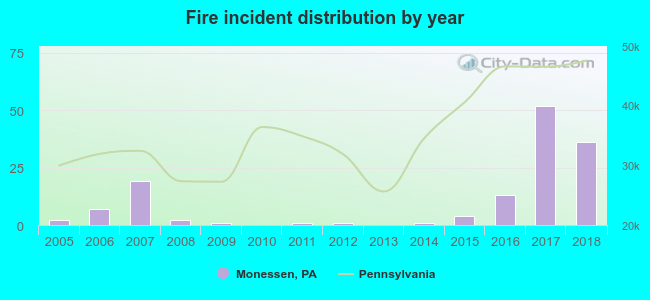 According to the data from the years 2005 - 2018 the average number of fire incidents per year is 10. The highest number of fires - 52 took place in 2017, and the least - 0 in 2010. The data has an increasing trend.
The average number of yearly fire incidents per 10k residents in Monessen, PA compared to nearest cities:
(Note: Based on data for the last 3 years, including only cities with population 5,000 and above)
| Monessen: | 44.7 |
| California: | 21.0 |
| Jefferson Hills: | 17.2 |
| Clairton: | 82.3 |
| Pleasant Hills: | 3.0 |
| McKeesport: | 43.3 |
| White Oak: | 18.3 |
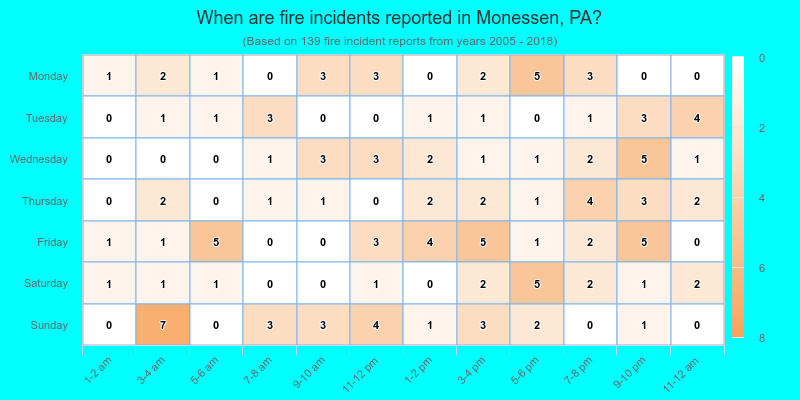
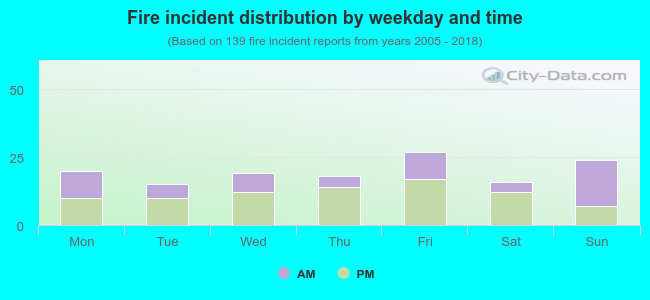 41.0% incidents where reported in the morning and 59.0% in the evening. The most fires (19.4%) took place on Friday, and the least (10.8%) on Tuesday.
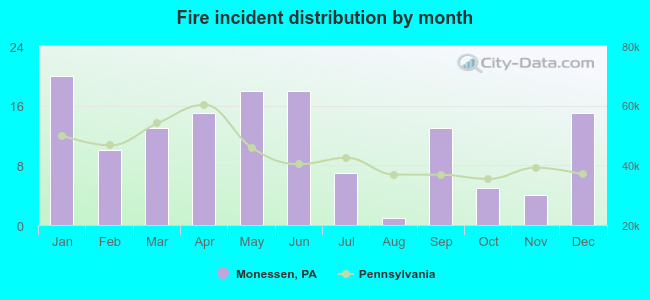 Based on the 139 incident reports from years 2005 - 2018 most fires (14.4%) took place during January, and the least (0.7%) in August.
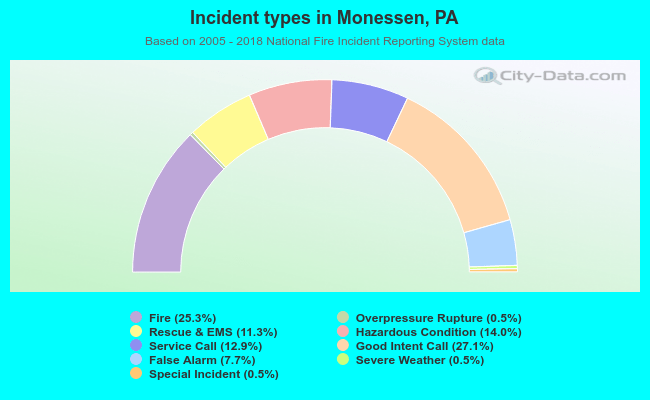 Out of all 549 cases reported during the years 2005 - 2018, the most belonged to the categories: Good Intent Call (27.1%), Fire (25.3%), and Hazardous Condition (14.0%).
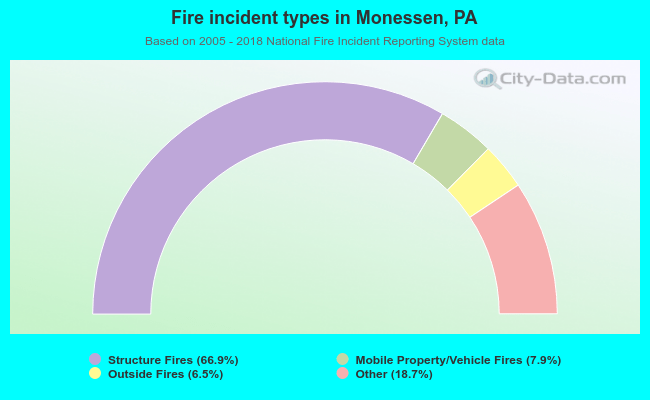 When looking into fire subcategories, the most incidents belonged to: Structure Fires (66.9%), and Other (18.7%).