Moberly: Fire Incidents, Missouri (MO)
Where are fire incidents reported in Moberly, MO
Something went wrong! Please refresh the page.
| Fire incidents reported | |
|---|---|
| Sreet name | Count |
| MORLEY ST | 148 |
| AULT ST | 68 |
| CLARK ST | 60 |
| FIFTH ST | 60 |
| ROLLINS ST | 56 |
| 24 HWY | 52 |
| HIGHWAY JJ | 48 |
| COATES ST | 40 |
| REED ST | 38 |
| CONCANNON ST | 36 |
| 63 HWY | 34 |
| SINNOCK AVE | 30 |
| WILLIAMS ST | 30 |
| LOGAN ST | 28 |
| FRANKLIN ST | 26 |
| MYRA ST | 26 |
| FOURTH ST | 24 |
| MONROE ST | 24 |
| TAYLOR ST | 24 |
| UNION AVE | 24 |
| COUNTY ROAD 1220 | 22 |
| WEST END PL | 22 |
| WOODLAND AVE | 22 |
| BOND ST | 20 |
| CARPENTER ST | 20 |
| COUNTY ROAD 1245 | 20 |
| MCKINSEY ST | 20 |
| BUCHANAN ST | 18 |
| FRANKLIN AVE | 18 |
| HAGOOD ST | 18 |
| Other | 356 |
2002 - 2018 National Fire Incident Reporting System (NFIRS) incidents
- Incident types reported to NFIRS in Moberly, MO
- 2,04236.0%Rescue & EMS
- 1,43225.2%Fire
- 94616.7%Hazardous Condition
- 68512.1%Service Call
- 3406.0%Good Intent Call
- 2033.6%False Alarm
- 150.3%Overpressure Rupture
- 90.2%Special Incident
- Fire incident types reported to NFIRS in Moberly, MO
- 79555.5%Outside Fires
- 45731.9%Structure Fires
- 16111.2%Mobile Property/Vehicle Fires
- 191.3%Other
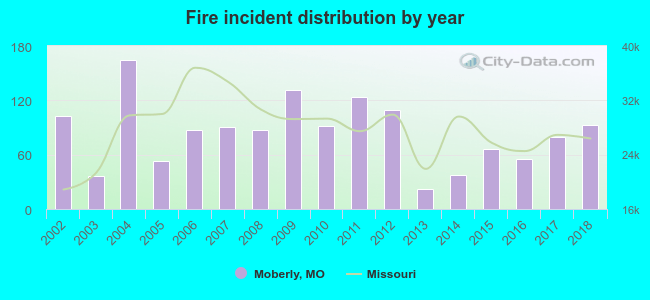 Based on the data from the years 2002 - 2018 the average number of fires per year is 84. The highest number of fires - 165 took place in 2004, and the least - 22 in 2013. The data has a decreasing trend.
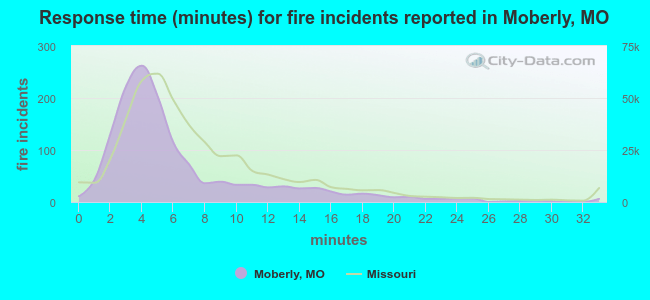 The median response time based on all reported fire incidents is 5 minutes. This is lower compared to the state median value.
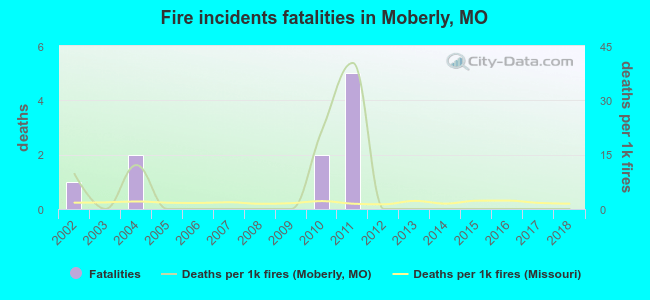 Based on the reports from the years 2002 - 2018 the average number of fire-related fatalities per year is 1. The highest number of deaths - 5 took place in 2011, and the lowest - 0 in 2003. The data has a dropping trend.
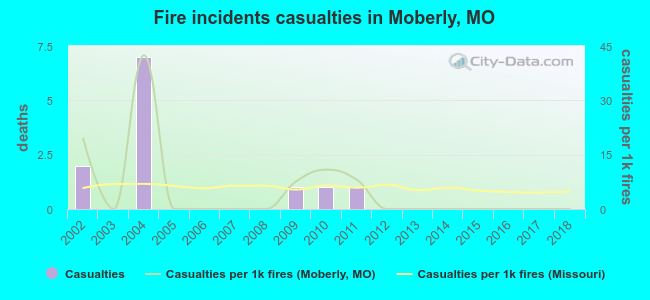 According to the reports from the years 2002 - 2018 the average number of fire-related casualties per year is 1. The highest number of reported injuries - 7 took place in 2004, and the lowest - 0 in 2003. The data has a declining trend.
The average number of injuries per 1,000 fire incidents is 5. This indicator was the highest - 42 in 2004, and the lowest 0 in 2003. The trend for injuries per 1,000 incidents is declining. Compared to the Missouri value the number of injuries per 1,000 fires is higher.
According to the reports from the years 2002 - 2018 the average number of fire-related casualties per year is 1. The highest number of reported injuries - 7 took place in 2004, and the lowest - 0 in 2003. The data has a declining trend.
The average number of injuries per 1,000 fire incidents is 5. This indicator was the highest - 42 in 2004, and the lowest 0 in 2003. The trend for injuries per 1,000 incidents is declining. Compared to the Missouri value the number of injuries per 1,000 fires is higher.
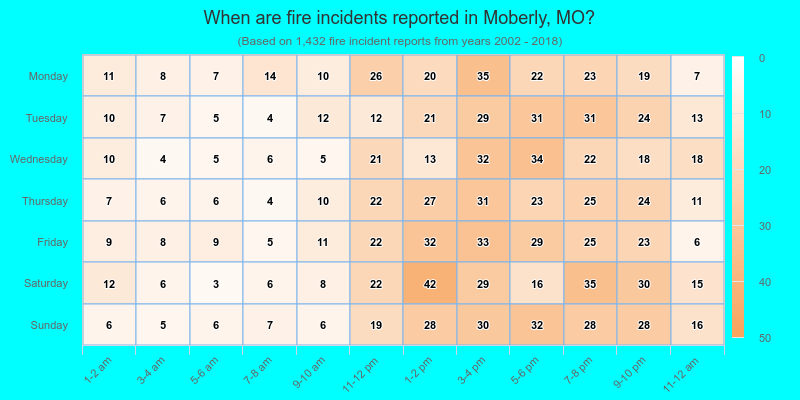
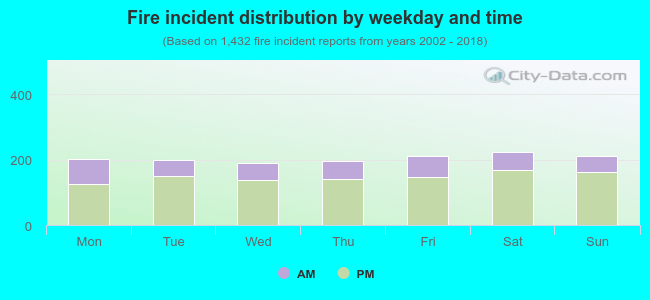 28.1% incidents where reported in the morning and 71.9% in the evening. The most fires (15.6%) took place on Saturday, and the least (13.1%) on Wednesday.
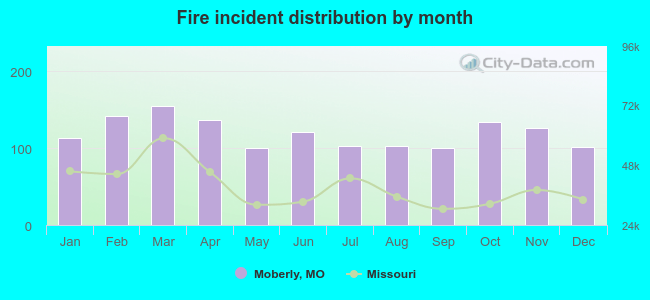 According to the 1,432 fire incidents from years 2002 - 2018 most fires (10.8%) took place during March, and the least (7.0%) in May.
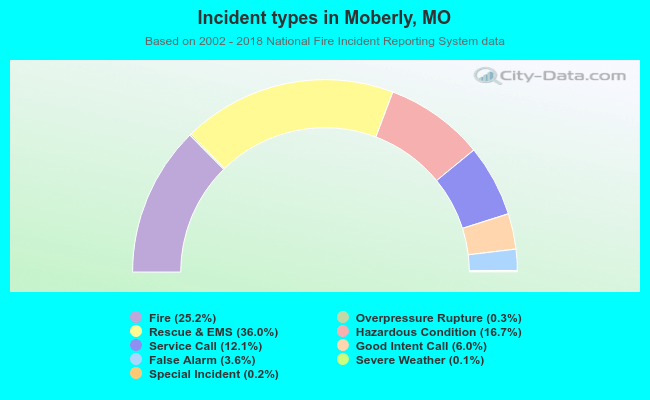 Out of all 5,675 cases reported during the years 2002 - 2018, the most belonged to the categories: Rescue & EMS (36.0%), Fire (25.2%), and Hazardous Condition (16.7%).
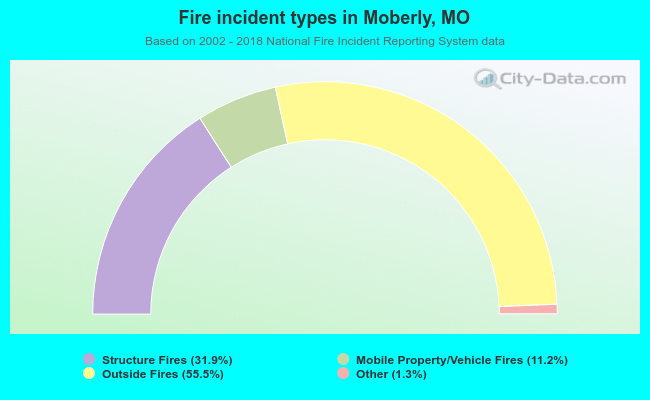 When looking into fire subcategories, the most incidents belonged to: Outside Fires (55.5%), and Structure Fires (31.9%).