Marianna: Fire Incidents, Florida (FL)
Where are fire incidents reported in Marianna, FL
Something went wrong! Please refresh the page.
| Fire incidents reported | |
|---|---|
| Sreet name | Count |
| HWY 90 | 100 |
| HWY 71 | 68 |
| LAFAYETTE ST. | 50 |
| HWY 73 | 34 |
| I10 | 32 |
| INTERSTATE 10 | 30 |
| OLD COTTONDALE RD. | 30 |
| HWY 73 SOUTH | 28 |
| LAFAYETTE ST | 26 |
| HIGHWAY 90 | 24 |
| HWY 71 SOUTH | 24 |
| 71 | 22 |
| I-10 | 22 |
| HWY 71 S | 20 |
| LAFAYETTE ST | 20 |
| HWY 167 | 16 |
| OLD COTTONDALE RD | 16 |
| OLD US ROAD | 16 |
| THOMPSON RD. | 16 |
| CAVERNS RD | 14 |
| CAVERNS RD. | 14 |
| DRY CREEK RD | 14 |
| PENN AVE | 14 |
| CARTERS MILL RD | 12 |
| CARTERS MILL RD | 12 |
| HWY 73 S | 12 |
| JEFFERSON ST. | 12 |
| TWIN PONDS RD | 12 |
| 90 | 10 |
| BLUE SPRINGS | 10 |
| Other | 1,627 |
2002 - 2018 National Fire Incident Reporting System (NFIRS) incidents
- Incident types reported to NFIRS in Marianna, FL
- 16,24875.2%Rescue & EMS
- 2,35710.9%Fire
- 1,3156.1%Good Intent Call
- 7153.3%Hazardous Condition
- 5292.4%False Alarm
- 3621.7%Service Call
- 540.2%Special Incident
- Fire incident types reported to NFIRS in Marianna, FL
- 86336.6%Outside Fires
- 81334.5%Structure Fires
- 51421.8%Mobile Property/Vehicle Fires
- 1677.1%Other
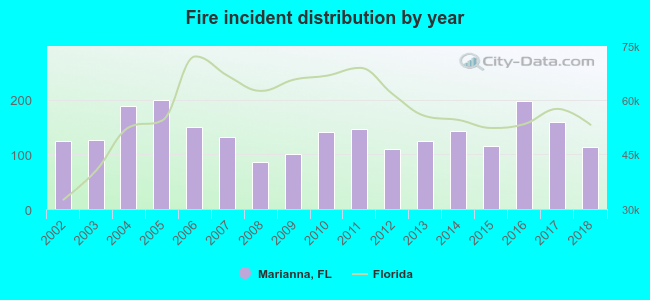 Based on the data from the years 2002 - 2018 the average number of fires per year is 139. The highest number of reported fires - 199 took place in 2005, and the least - 86 in 2008. The data has a dropping trend.
The average number of yearly fire incidents per 10k residents in Marianna, FL compared to nearest cities:
(Note: Based on data for the last 3 years, including only cities with population 5,000 and above)
| Marianna: | 169.4 |
| Cypress: | 4.3 |
| Youngstown: | 35.9 |
| Quincy: | 221.5 |
| Southport: | 32.9 |
| Lynn Haven: | 21.9 |
 The median response time based on all reported fire incidents is 7 minutes. This is comparable to the Florida median value.
The median response time in Marianna, FL compared to nearest cities:
(Note: Based on data for all years, including only cities with at least 500 fire incidents)
| Marianna: | 7 minutes |
| Cottondale: | 10 minutes |
| Chipley: | 10 minutes |
| Graceville: | 10 minutes |
| Blountstown: | 4 minutes |
| Bonifay: | 8 minutes |
| Dothan: | 5 minutes |
| Westville: | 10 minutes |
| Quincy: | 6 minutes |
 Based on the data from the years 2002 - 2018 the average number of fire-related yearly deaths is 1. The highest number of deaths - 8 took place in 2014, and the lowest - 0 in 2002. The data has a constant trend.
 According to the reports from the years 2002 - 2018 the average number of fire-related casualties per year is 0. The highest number of reported casualties - 2 took place in 2003, and the lowest - 0 in 2002. The data has a constant trend.
The average number of injuries per 1,000 fire incidents is 3. This indicator was the highest - 17 in 2015, and the lowest 0 in 2002. The trend for injuries per 1,000 fire incidents is constant. Compared to the state value the number of injuries per 1,000 fire incidents is much lower.
According to the reports from the years 2002 - 2018 the average number of fire-related casualties per year is 0. The highest number of reported casualties - 2 took place in 2003, and the lowest - 0 in 2002. The data has a constant trend.
The average number of injuries per 1,000 fire incidents is 3. This indicator was the highest - 17 in 2015, and the lowest 0 in 2002. The trend for injuries per 1,000 fire incidents is constant. Compared to the state value the number of injuries per 1,000 fire incidents is much lower.Casualties per 1,000 incidents in Marianna, FL compared to nearest cities:
(Note: Based on data for all years, including only cities with at least 500 fire incidents)
| Marianna: | 2.5 |
| Cottondale: | 1.3 |
| Chipley: | 0.0 |
| Graceville: | 0.0 |
| Blountstown: | 1.4 |
| Bonifay: | 2.9 |
| Dothan: | 14.0 |
| Westville: | 1.7 |
| Quincy: | 5.3 |
 31.6% incidents where reported in the morning and 68.4% in the evening. The most fires (16.8%) took place on Saturday, and the least (12.7%) on Tuesday.
 Based on the 2,357 reports from years 2002 - 2018 most fires (12.1%) took place during March, and the least (6.7%) in August.
 Out of all 21,611 cases reported during the years 2002 - 2018, the most belonged to the categories: Rescue & EMS (75.2%), Fire (10.9%), and Good Intent Call (6.1%).
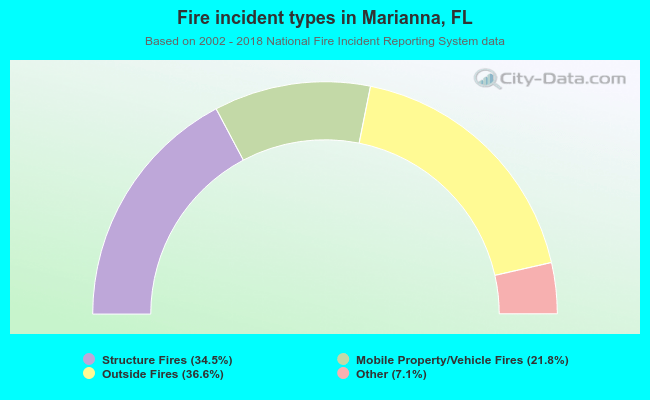 When looking into fire subcategories, the most reports belonged to: Outside Fires (36.6%), and Structure Fires (34.5%).