Mansfield: Fire Incidents, Connecticut (CT)
Where are fire incidents reported in Mansfield, CT
Something went wrong! Please refresh the page.
|
| |||||||||||||||||||||||||||||||||||||||||||||||||||||||||||||||||||||||||||||||||||||||||||||||||||||||||||||
2002 - 2018 National Fire Incident Reporting System (NFIRS) incidents
- Incident types reported to NFIRS in Mansfield, CT
- 69455.6%Rescue & EMS
- 26020.8%Fire
- 15812.7%Good Intent Call
- 645.1%Service Call
- 373.0%Hazardous Condition
- 342.7%False Alarm
- 20.2%Overpressure Rupture
- Fire incident types reported to NFIRS in Mansfield, CT
- 21984.2%Structure Fires
- 259.6%Outside Fires
- 145.4%Other
- 20.8%Mobile Property/Vehicle Fires
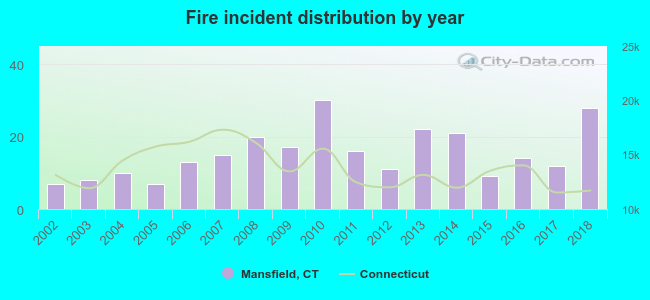 According to the data from the years 2002 - 2018 the average number of fires per year is 15. The highest number of reported fires - 30 took place in 2010, and the least - 7 in 2002. The data has a growing trend.
The average number of yearly fire incidents per 10k residents in Mansfield, CT compared to nearest cities:
(Note: Based on data for the last 3 years, including only cities with population 5,000 and above)
| Mansfield: | 6.8 |
| Storrs: | 26.1 |
| Coventry: | 10.2 |
| Willimantic: | 41.5 |
| Windham: | 5.9 |
| Columbia: | 41.3 |
| Willington: | 14.3 |
| Tolland: | 20.2 |
| Lebanon: | 32.8 |

 28.1% incidents where reported in the morning and 71.9% in the evening. The most fires (23.1%) took place on Sunday, and the least (9.2%) on Wednesday.
 Based on the 260 fires from years 2002 - 2018 most fires (13.5%) took place during April, and the least (3.5%) in June.
 Out of all 1,249 cases reported during the years 2002 - 2018, the most belonged to the categories: Rescue & EMS (55.6%), Fire (20.8%), and Good Intent Call (12.7%).
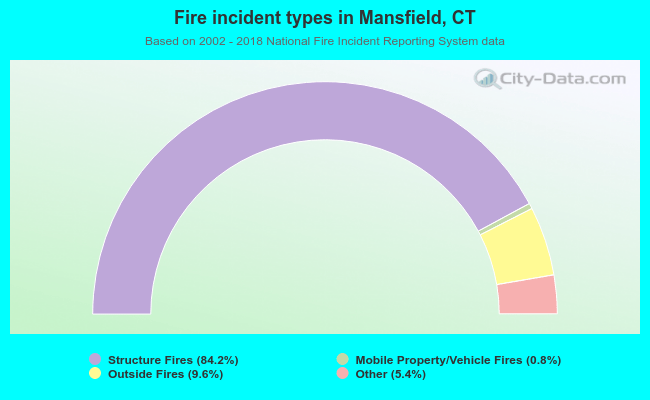 When looking into fire subcategories, the most incidents belonged to: Structure Fires (84.2%), and Outside Fires (9.6%).