Lytle: Fire Incidents, Texas (TX)
Where are fire incidents reported in Lytle, TX
Something went wrong! Please refresh the page.
|
| |||||||||||||||||||||||||||||||||||||||||||||||||||||||||||||||||||||||||||||||||||||||||||||||||||||||||||||
2003 - 2018 National Fire Incident Reporting System (NFIRS) incidents
- Incident types reported to NFIRS in Lytle, TX
- 25542.1%Fire
- 18330.2%Rescue & EMS
- 8213.6%Good Intent Call
- 335.5%False Alarm
- 274.5%Hazardous Condition
- 233.8%Service Call
- 20.3%Overpressure Rupture
- Fire incident types reported to NFIRS in Lytle, TX
- 15962.4%Outside Fires
- 7529.4%Structure Fires
- 176.7%Mobile Property/Vehicle Fires
- 41.6%Other
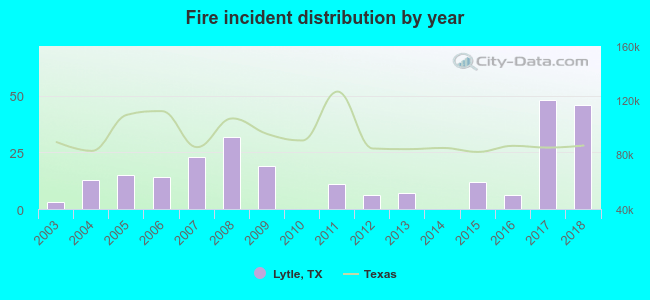 According to the data from the years 2003 - 2018 the average number of fire incidents per year is 16. The highest number of reported fires - 48 took place in 2017, and the least - 0 in 2010. The data has an increasing trend.
 26.3% incidents where reported in the morning and 73.7% in the evening. The most fires (15.3%) took place on Tuesday, and the least (11.8%) on Friday.
 According to the 255 reports from years 2003 - 2018 most fires (17.6%) took place during January, and the least (4.3%) in May.
 Out of all 605 cases reported during the years 2003 - 2018, the most belonged to the categories: Fire (42.1%), Rescue & EMS (30.2%), and Good Intent Call (13.6%).
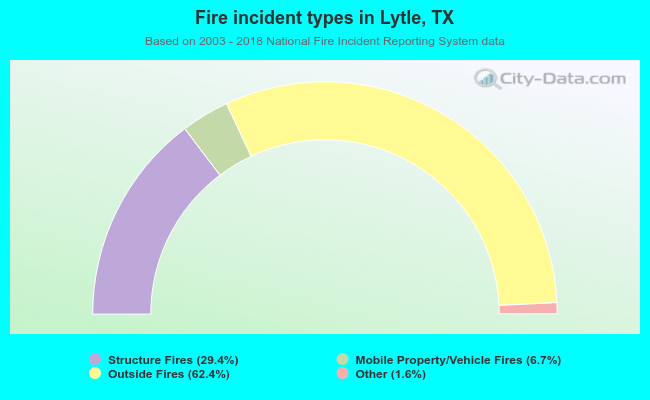 When looking into fire subcategories, the most reports belonged to: Outside Fires (62.4%), and Structure Fires (29.4%).