Los Lunas: Fire Incidents, New Mexico (NM)
Where are fire incidents reported in Los Lunas, NM
Something went wrong! Please refresh the page.
| Fire incidents reported | |
|---|---|
| Sreet name | Count |
| HIGHWAY 47 | 150 |
| HWY 47 | 94 |
| HWY 314 | 82 |
| MEADOW LAKE RD | 64 |
| BRAZARO | 58 |
| LOS LENTES | 58 |
| EL CERRO LOOP | 54 |
| LA ENTRADA | 46 |
| HWY 47 HWY | 42 |
| MAIN ST | 42 |
| BONITA VISTA | 40 |
| 47 HWY | 36 |
| ROMERO RD | 36 |
| CARMEL | 34 |
| EL CERRO MISSION BLVD | 34 |
| MANZANO EXPY | 34 |
| PEYTON RD | 34 |
| RIO DEL ORO LOOP | 34 |
| MISSION PARK LOOP | 30 |
| EDEAL RD | 28 |
| MILLER RD | 28 |
| MORRIS RD | 28 |
| AMY RD | 26 |
| CARMEL RD | 26 |
| CEREZA CIR | 26 |
| HAZEL | 26 |
| JUAN P SANCHEZ RD | 26 |
| PACIFICA | 26 |
| DON PASQUAL | 24 |
| HAZEL ST | 24 |
| Other | 2,925 |
2003 - 2018 National Fire Incident Reporting System (NFIRS) incidents
- Incident types reported to NFIRS in Los Lunas, NM
- 4,21552.4%Fire
- 1,34016.7%Service Call
- 96312.0%Hazardous Condition
- 5987.4%Good Intent Call
- 5026.2%Rescue & EMS
- 3244.0%False Alarm
- 750.9%Special Incident
- 230.3%Overpressure Rupture
- Fire incident types reported to NFIRS in Los Lunas, NM
- 2,43257.7%Outside Fires
- 1,06625.3%Structure Fires
- 3899.2%Other
- 3287.8%Mobile Property/Vehicle Fires
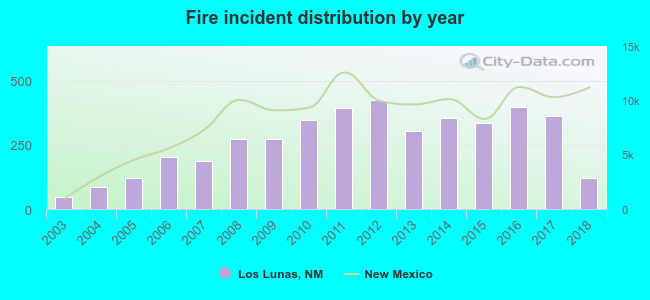 According to the data from the years 2003 - 2018 the average number of fire incidents per year is 263. The highest number of reported fire incidents - 423 took place in 2012, and the least - 47 in 2003. The data has a growing trend.
The average number of yearly fire incidents per 10k residents in Los Lunas, NM compared to nearest cities:
(Note: Based on data for the last 3 years, including only cities with population 5,000 and above)
| Los Lunas: | 192.2 |
| Los Chaves: | 28.8 |
| Belen: | 195.1 |
| South Valley: | 2.0 |
| Albuquerque: | 25.7 |
| North Valley: | 4.1 |
| Corrales: | 18.3 |
| Rio Rancho: | 17.1 |
| Bernalillo: | 39.3 |
 The median response time based on all reported fire incidents is 10 minutes. This is higher than the New Mexico median value.
The median response time in Los Lunas, NM compared to nearest cities:
(Note: Based on data for all years, including only cities with at least 500 fire incidents)
| Los Lunas: | 10 minutes |
| Belen: | 10 minutes |
| Jarales: | 11 minutes |
| Albuquerque: | 7 minutes |
| Tijeras: | 11 minutes |
| Rio Rancho: | 8 minutes |
| Edgewood: | 12 minutes |
| Moriarty: | 12 minutes |
 Based on the reports from the years 2003 - 2018 the average number of fire-related yearly deaths is 0. The highest number of reported deaths - 3 took place in 2011, and the lowest - 0 in 2003. The data has a constant trend.
The average number of deaths per 1,000 fires is 1. This indicator was the highest - 8 in 2011, and the lowest 0 in 2003. The trend for deaths per 1,000 fires is constant. Compared to the New Mexico value the number of fatalities per 1,000 fires is lower.
Based on the reports from the years 2003 - 2018 the average number of fire-related yearly deaths is 0. The highest number of reported deaths - 3 took place in 2011, and the lowest - 0 in 2003. The data has a constant trend.
The average number of deaths per 1,000 fires is 1. This indicator was the highest - 8 in 2011, and the lowest 0 in 2003. The trend for deaths per 1,000 fires is constant. Compared to the New Mexico value the number of fatalities per 1,000 fires is lower.Deaths per 1,000 incidents in Los Lunas, NM compared to nearest cities:
(Note: Based on data for all years, including only cities with at least 2,500 fire incidents)
| Los Lunas: | 1.2 |
| Albuquerque: | 0.7 |
 Based on the reports from the years 2003 - 2018 the average number of fire-related yearly casualties is 0. The highest number of reported injuries - 2 took place in 2005, and the lowest - 0 in 2003. The data has a constant trend.
The average number of injuries per 1,000 fires is 2. This indicator was the highest - 17 in 2005, and the lowest 0 in 2003. The trend for casualties per 1,000 fires is constant. Compared to the New Mexico value the number of casualties per 1,000 fires is lower.
Based on the reports from the years 2003 - 2018 the average number of fire-related yearly casualties is 0. The highest number of reported injuries - 2 took place in 2005, and the lowest - 0 in 2003. The data has a constant trend.
The average number of injuries per 1,000 fires is 2. This indicator was the highest - 17 in 2005, and the lowest 0 in 2003. The trend for casualties per 1,000 fires is constant. Compared to the New Mexico value the number of casualties per 1,000 fires is lower.Casualties per 1,000 incidents in Los Lunas, NM compared to nearest cities:
(Note: Based on data for all years, including only cities with at least 500 fire incidents)
| Los Lunas: | 1.7 |
| Belen: | 2.0 |
| Jarales: | 0.0 |
| Albuquerque: | 3.1 |
| Tijeras: | 1.8 |
| Rio Rancho: | 16.2 |
| Edgewood: | 1.5 |
| Moriarty: | 1.7 |
 28.4% incidents where reported in the morning and 71.6% in the evening. The most fires (16.4%) took place on Saturday, and the least (13.2%) on Friday.
 Based on the 4,215 fires from years 2003 - 2018 most fires (11.2%) took place during March, and the least (6.5%) in October.
 Out of all 8,045 cases reported during the years 2003 - 2018, the most belonged to the categories: Fire (52.4%), Service Call (16.7%), and Hazardous Condition (12.0%).
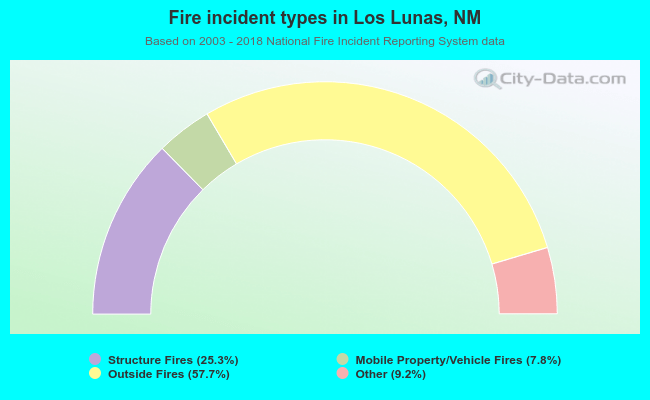 When looking into fire subcategories, the most incidents belonged to: Outside Fires (57.7%), and Structure Fires (25.3%).