Los Banos: Fire Incidents, California (CA)
Where are fire incidents reported in Los Banos, CA
Something went wrong! Please refresh the page.
| Fire incidents reported | |
|---|---|
| Sreet name | Count |
| PACHECO BLVD | 284 |
| I ST | 92 |
| G ST | 90 |
| PACHECO BL | 62 |
| MERCEY SPRINGS RD | 58 |
| H ST | 54 |
| F ST | 42 |
| WARD RD | 36 |
| SAN LUIS ST | 32 |
| J ST | 28 |
| 7TH ST | 26 |
| CANAL FARM LN | 26 |
| D ST | 26 |
| E ST | 26 |
| PLACE RD | 26 |
| MERCEY SPRINGS | 24 |
| MERCEY SPRINGS ST | 24 |
| BADGER FLAT RD | 22 |
| K ST | 22 |
| STONEWOOD DR | 22 |
| 8TH ST | 20 |
| GILBERT GONZALEZ JR DR | 18 |
| RACQUET CLUB DR | 18 |
| ILLINOIS AVE | 16 |
| OVERLAND AVE | 16 |
| C ST | 14 |
| RAIL TRAIL | 14 |
| 2ND ST | 12 |
| 6TH ST | 12 |
| I5 | 12 |
| Other | 116 |
2004 - 2018 National Fire Incident Reporting System (NFIRS) incidents
- Incident types reported to NFIRS in Los Banos, CA
- 3,82942.8%Rescue & EMS
- 1,46016.3%Good Intent Call
- 1,29014.4%Fire
- 1,21113.5%Service Call
- 6136.9%False Alarm
- 5225.8%Hazardous Condition
- 140.2%Special Incident
- Fire incident types reported to NFIRS in Los Banos, CA
- 77960.4%Outside Fires
- 28622.2%Structure Fires
- 17413.5%Mobile Property/Vehicle Fires
- 514.0%Other
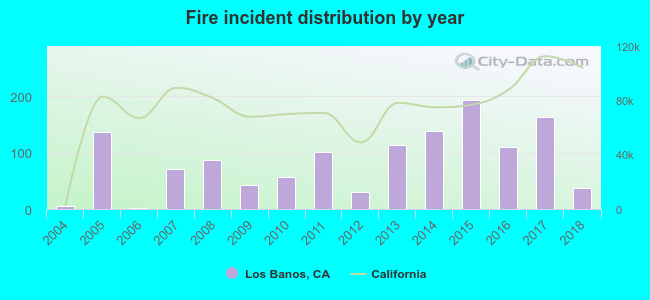 Based on the data from the years 2004 - 2018 the average number of fires per year is 86. The highest number of reported fire incidents - 193 took place in 2015, and the least - 1 in 2006. The data has a rising trend.
The average number of yearly fire incidents per 10k residents in Los Banos, CA compared to nearest cities:
(Note: Based on data for the last 3 years, including only cities with population 5,000 and above)
| Los Banos: | 28.1 |
| Dos Palos: | 7.2 |
| Gustine: | 45.7 |
| Newman: | 19.8 |
| Livingston: | 21.0 |
| Atwater: | 23.0 |
| Delhi: | 81.2 |
| Firebaugh: | 42.6 |
| Winton: | 48.1 |
 The median response time based on all reported fire incidents is 5 minutes. This is lower than the California median value.
The median response time in Los Banos, CA compared to nearest cities:
(Note: Based on data for all years, including only cities with at least 500 fire incidents)
| Los Banos: | 5 minutes |
| Atwater: | 9 minutes |
| Delhi: | 7 minutes |
| Winton: | 6 minutes |
| Merced: | 5 minutes |
| Turlock: | 5 minutes |
| Chowchilla: | 8 minutes |
| Patterson: | 5 minutes |
| Mendota: | 11 minutes |
 26.9% incidents where reported in the morning and 73.1% in the evening. The most fires (15.9%) took place on Friday, and the least (12.2%) on Saturday.
 Based on the 1,290 fire incident reports from years 2004 - 2018 most fires (13.0%) took place during July, and the least (5.3%) in November.
 Out of all 8,945 cases reported during the years 2004 - 2018, the most belonged to the categories: Rescue & EMS (42.8%), Good Intent Call (16.3%), and Fire (14.4%).
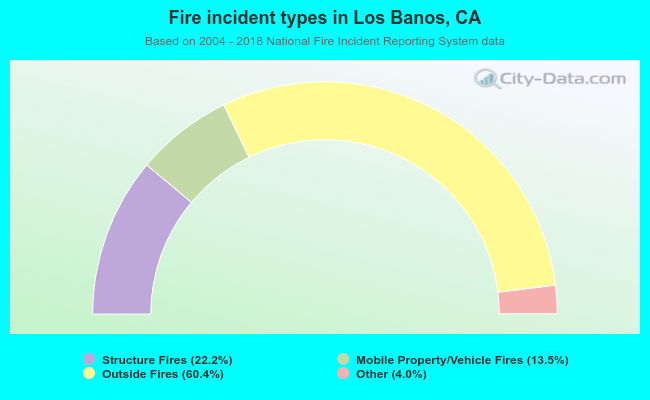 When looking into fire subcategories, the most incidents belonged to: Outside Fires (60.4%), and Structure Fires (22.2%).