Los Alamitos: Fire Incidents, California (CA)
Where are fire incidents reported in Los Alamitos, CA
Something went wrong! Please refresh the page.
|
| |||||||||||||||||||||||||||||||||||||||||||||||||||||||||||||||||||||||||||||||||||||||||||||||||||||||||||||
2005 - 2018 National Fire Incident Reporting System (NFIRS) incidents
- Incident types reported to NFIRS in Los Alamitos, CA
- 4,01672.3%Rescue & EMS
- 5179.3%Good Intent Call
- 2995.4%Fire
- 2734.9%False Alarm
- 2444.4%Service Call
- 1983.6%Hazardous Condition
- 70.1%Overpressure Rupture
- Fire incident types reported to NFIRS in Los Alamitos, CA
- 10635.5%Outside Fires
- 9933.1%Mobile Property/Vehicle Fires
- 7424.7%Structure Fires
- 206.7%Other
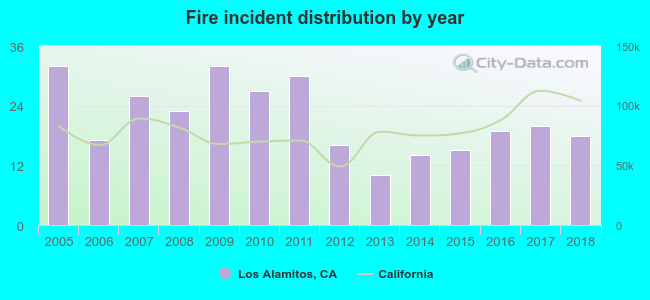 According to the data from the years 2005 - 2018 the average number of fire incidents per year is 21. The highest number of fires - 32 took place in 2005, and the least - 10 in 2013. The data has a decreasing trend.
The average number of yearly fire incidents per 10k residents in Los Alamitos, CA compared to nearest cities:
(Note: Based on data for the last 3 years, including only cities with population 5,000 and above)
| Los Alamitos: | 16.2 |
| Rossmoor: | 2.3 |
| Cypress: | 8.7 |
| Hawaiian Gardens: | 20.8 |
| Seal Beach: | 17.8 |
| La Palma: | 7.8 |
| Stanton: | 12.4 |
| Lakewood: | 12.0 |
| Cerritos: | 14.6 |

 Based on the reports from the years 2005 - 2018 the average number of fire-related yearly casualties is 0. The highest number of casualties - 2 took place in 2006, and the lowest - 0 in 2005. The data has a constant trend.
 35.5% incidents where reported in the morning and 64.5% in the evening. The most fires (16.4%) took place on Wednesday, and the least (11.4%) on Saturday.
 According to the 299 fire incidents from years 2005 - 2018 most fires (10.7%) took place during February, and the least (4.3%) in June.
 Out of all 5,557 cases reported during the years 2005 - 2018, the most belonged to the categories: Rescue & EMS (72.3%), Good Intent Call (9.3%), and Fire (5.4%).
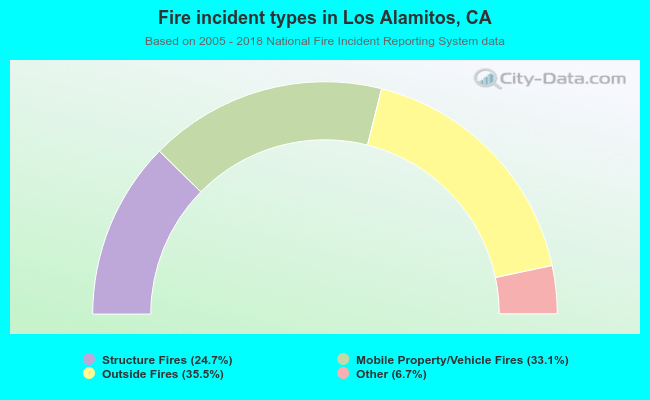 When looking into fire subcategories, the most incidents belonged to: Outside Fires (35.5%), and Mobile Property/Vehicle Fires (33.1%).