Loon Lake: Fire Incidents, Washington (WA)
Where are fire incidents reported in Loon Lake, WA
Something went wrong! Please refresh the page.
|
| |||||||||||||||||||||||||||||||||||||||||||||||||||||||||||||||||||||||||||||||||||||||||||||||||||||||||||||
2002 - 2018 National Fire Incident Reporting System (NFIRS) incidents
- Incident types reported to NFIRS in Loon Lake, WA
- 74847.1%Rescue & EMS
- 35322.2%Fire
- 24515.4%Service Call
- 1418.9%Good Intent Call
- 674.2%Hazardous Condition
- 301.9%False Alarm
- 40.3%Special Incident
- Fire incident types reported to NFIRS in Loon Lake, WA
- 16346.2%Outside Fires
- 11632.9%Structure Fires
- 4613.0%Other
- 287.9%Mobile Property/Vehicle Fires
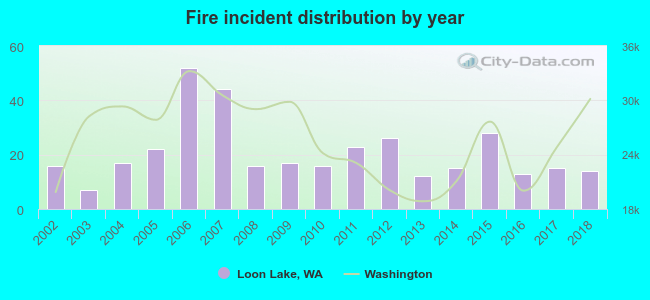 According to the data from the years 2002 - 2018 the average number of fire incidents per year is 21. The highest number of fire incidents - 52 took place in 2006, and the least - 7 in 2003. The data has a decreasing trend.
The average number of yearly fire incidents per 10k residents in Loon Lake, WA compared to nearest cities:
(Note: Based on data for the last 3 years, including only cities with population 5,000 and above)
| Loon Lake: | 15.7 |
| Mead: | 13.3 |
| Colbert: | 10.8 |
| Airway Heights: | 76.4 |
| Spokane: | 48.3 |
| Spokane Valley: | 34.0 |
| Veradale: | 2.0 |
| Cheney: | 72.1 |
| Liberty Lake: | 22.4 |

 32.0% incidents where reported in the morning and 68.0% in the evening. The most fires (16.7%) took place on Sunday, and the least (11.0%) on Wednesday.
 Based on the 353 fire incidents from years 2002 - 2018 most fires (15.6%) took place during July, and the least (4.8%) in March.
 Out of all 1,589 cases reported during the years 2002 - 2018, the most belonged to the categories: Overpressure Rupture (47.1%), Fire (22.2%), and Hazardous Condition (15.4%).
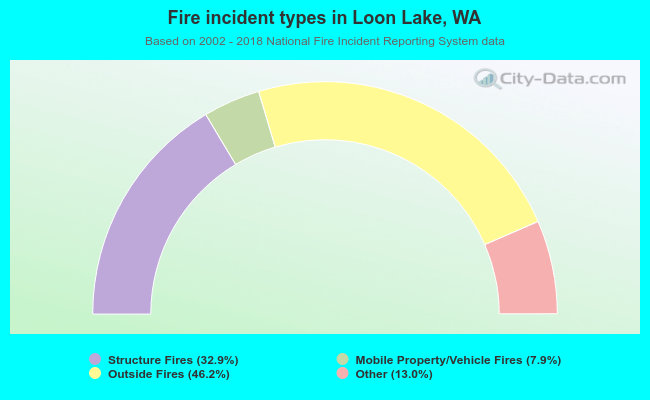 When looking into fire subcategories, the most incidents belonged to: Outside Fires (46.2%), and Structure Fires (32.9%).