Longview: Fire Incidents, Washington (WA)
Where are fire incidents reported in Longview, WA
Something went wrong! Please refresh the page.
| Fire incidents reported | |
|---|---|
| Sreet name | Count |
| INDUSTRIAL WY | 272 |
| OCEAN BEACH HW | 266 |
| OCEAN BEACH HWY | 242 |
| WILLOW GROVE RD | 210 |
| INDUSTRIAL WAY | 178 |
| 18TH AV | 150 |
| 15TH AV | 142 |
| 17TH AV | 114 |
| TENNANT WY | 106 |
| FIBRE WAY | 104 |
| 19TH AV | 102 |
| 15TH AVE | 98 |
| COAL CREEK RD | 92 |
| COMMERCE AV | 92 |
| 20TH AV | 90 |
| COMMERCE AVE | 90 |
| 23RD AV | 86 |
| BEECH ST | 84 |
| TENNANT WAY | 84 |
| 9TH AV | 78 |
| BALTIMORE ST | 76 |
| 24TH AV | 74 |
| CALIFORNIA WY | 74 |
| DOUGLAS ST | 74 |
| HEMLOCK ST | 74 |
| 7TH AV | 72 |
| PENNSYLVANIA ST | 70 |
| 7TH AVE | 66 |
| FIBRE WY | 66 |
| 12TH AV | 64 |
| Other | 1,160 |
2002 - 2018 National Fire Incident Reporting System (NFIRS) incidents
- Incident types reported to NFIRS in Longview, WA
- 23,45159.5%Rescue & EMS
- 5,64814.3%Good Intent Call
- 4,55011.5%Fire
- 3,0677.8%Service Call
- 1,4023.6%False Alarm
- 1,1242.9%Hazardous Condition
- 1140.3%Special Incident
- 460.1%Overpressure Rupture
- Fire incident types reported to NFIRS in Longview, WA
- 2,03144.6%Outside Fires
- 1,59135.0%Structure Fires
- 59513.1%Mobile Property/Vehicle Fires
- 3337.3%Other
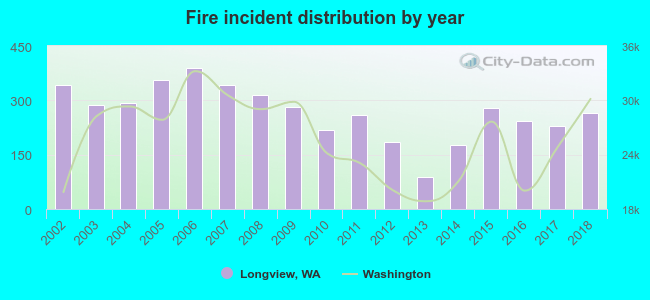 According to the data from the years 2002 - 2018 the average number of fire incidents per year is 268. The highest number of fire incidents - 390 took place in 2006, and the least - 88 in 2013. The data has a decreasing trend.
The average number of yearly fire incidents per 10k residents in Longview, WA compared to nearest cities:
(Note: Based on data for the last 3 years, including only cities with population 5,000 and above)
| Longview: | 67.3 |
| Kelso: | 126.7 |
| Rose Valley: | 4.0 |
| Woodland: | 66.0 |
| Ridgefield: | 110.5 |
| Battle Ground: | 61.6 |
| Hazel Dell: | 4.1 |
| Chehalis: | 282.8 |
| Vancouver: | 40.5 |
 The median response time based on all reported fire incidents is 5 minutes. This is lower compared to the state median value.
The median response time in Longview, WA compared to nearest cities:
(Note: Based on data for all years, including only cities with at least 500 fire incidents)
| Longview: | 5 minutes |
| Kelso: | 7 minutes |
| Castle Rock: | 9 minutes |
| Woodland: | 7 minutes |
| Toledo: | 11 minutes |
| Winlock: | 11 minutes |
| Ridgefield: | 7 minutes |
| Scappoose: | 8 minutes |
| Battle Ground: | 6 minutes |
 Based on the reports from the years 2002 - 2018 the average number of fire-related yearly casualties is 1. The highest number of reported casualties - 4 took place in 2003, and the lowest - 0 in 2005. The data has a declining trend.
The average number of injuries per 1,000 fire incidents is 4. This indicator was the highest - 14 in 2003, and the lowest 0 in 2005. The trend for casualties per 1,000 incidents is dropping. Compared to the Washington value the number of casualties per 1,000 fire incidents is lower.
Based on the reports from the years 2002 - 2018 the average number of fire-related yearly casualties is 1. The highest number of reported casualties - 4 took place in 2003, and the lowest - 0 in 2005. The data has a declining trend.
The average number of injuries per 1,000 fire incidents is 4. This indicator was the highest - 14 in 2003, and the lowest 0 in 2005. The trend for casualties per 1,000 incidents is dropping. Compared to the Washington value the number of casualties per 1,000 fire incidents is lower.Casualties per 1,000 incidents in Longview, WA compared to nearest cities:
(Note: Based on data for all years, including only cities with at least 500 fire incidents)
| Longview: | 4.6 |
| Kelso: | 6.5 |
| Castle Rock: | 1.7 |
| Woodland: | 4.8 |
| Toledo: | 1.1 |
| Winlock: | 0.0 |
| Ridgefield: | 3.0 |
| Scappoose: | 17.4 |
| Battle Ground: | 2.0 |
 34.4% incidents where reported in the morning and 65.6% in the evening. The most fires (16.6%) took place on Saturday, and the least (12.8%) on Tuesday.
 Based on the 4,550 fire incidents from years 2002 - 2018 most fires (16.3%) took place during July, and the least (5.5%) in March.
 Out of all 39,410 cases reported during the years 2002 - 2018, the most belonged to the categories: Rescue & EMS (59.5%), Good Intent Call (14.3%), and Fire (11.5%).
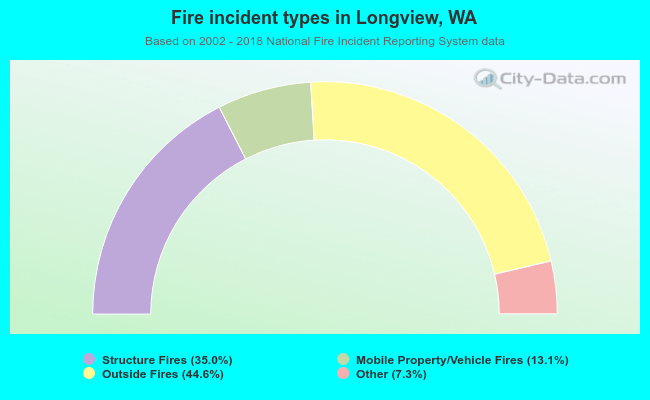 When looking into fire subcategories, the most incidents belonged to: Outside Fires (44.6%), and Structure Fires (35.0%).