Lock Haven: Fire Incidents, Pennsylvania (PA)
Where are fire incidents reported in Lock Haven, PA
Something went wrong! Please refresh the page.
| Fire incidents reported | |
|---|---|
| Sreet name | Count |
| MAIN ST | 404 |
| CHURCH ST | 254 |
| BELLEFONTE AVE | 160 |
| BALD EAGLE ST | 156 |
| FAIRVIEW ST | 132 |
| WATER ST | 124 |
| PARK ST | 116 |
| JONES ST | 92 |
| GROVE ST | 60 |
| CREE DR | 52 |
| WOODS AVE | 42 |
| CENTER ST | 40 |
| COUDERSPORT PIKE | 40 |
| HIGHLAND ST | 36 |
| SUSQUEHANNA AVE | 34 |
| CLINTON ST | 30 |
| HENDERSON ST | 30 |
| WALNUT ST | 26 |
| FARRANDSVILLE RD | 24 |
| CARRIER RD | 22 |
| FIRST ST | 22 |
| FOURTH ST | 22 |
| WOODWARD AVE | 22 |
| BENNAGE AVE | 20 |
| HEMLOCK DR | 20 |
| VESPER ST | 20 |
| UNIVERSITY DR | 18 |
| GLENN RD | 16 |
| LINDEN ST | 16 |
| WASHINGTON ST | 16 |
2003 - 2018 National Fire Incident Reporting System (NFIRS) incidents
- Incident types reported to NFIRS in Lock Haven, PA
- 1,32631.1%Fire
- 83119.5%Hazardous Condition
- 67515.8%Rescue & EMS
- 61214.4%Service Call
- 43210.1%False Alarm
- 3357.9%Good Intent Call
- 250.6%Severe Weather
- 150.4%Special Incident
- 110.3%Overpressure Rupture
- Fire incident types reported to NFIRS in Lock Haven, PA
- 1,03478.0%Structure Fires
- 16412.4%Outside Fires
- 715.4%Mobile Property/Vehicle Fires
- 574.3%Other
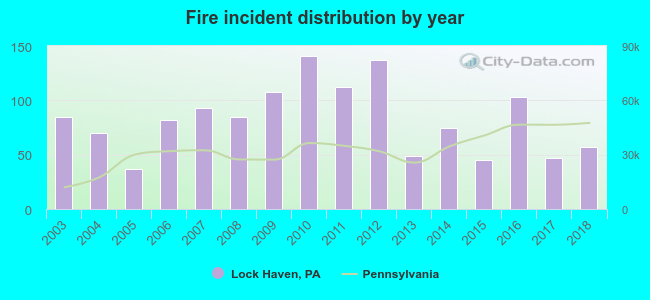 According to the data from the years 2003 - 2018 the average number of fires per year is 83. The highest number of reported fires - 141 took place in 2010, and the least - 37 in 2005. The data has a declining trend.
The average number of yearly fire incidents per 10k residents in Lock Haven, PA compared to nearest cities:
(Note: Based on data for the last 3 years, including only cities with population 5,000 and above)
| Lock Haven: | 70.0 |
| Bellefonte: | 29.4 |
| Williamsport: | 29.2 |
| South Williamsport: | 14.2 |
| Lewisburg: | 39.8 |
| State College: | 23.9 |
| Milton: | 30.6 |
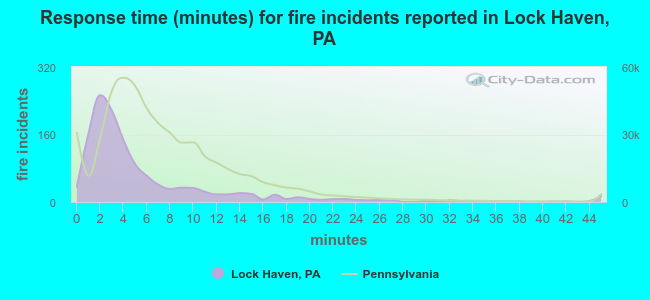 The median response time based on all reported fire incidents is 3 minutes. This is much lower than the Pennsylvania median value.
The median response time in Lock Haven, PA compared to nearest cities:
(Note: Based on data for all years, including only cities with at least 500 fire incidents)
| Lock Haven: | 3 minutes |
| Bellefonte: | 10 minutes |
| Williamsport: | 5 minutes |
| State College: | 8 minutes |
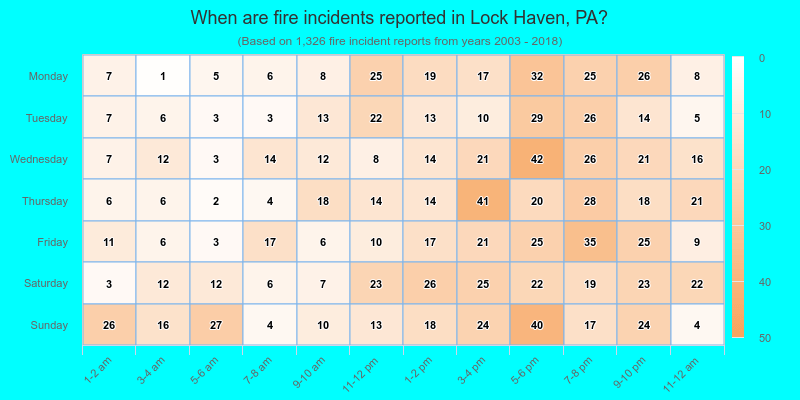
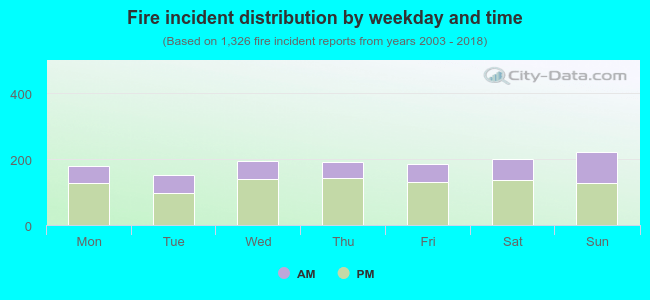 32.0% incidents where reported in the morning and 68.0% in the evening. The most fires (16.8%) took place on Sunday, and the least (11.4%) on Tuesday.
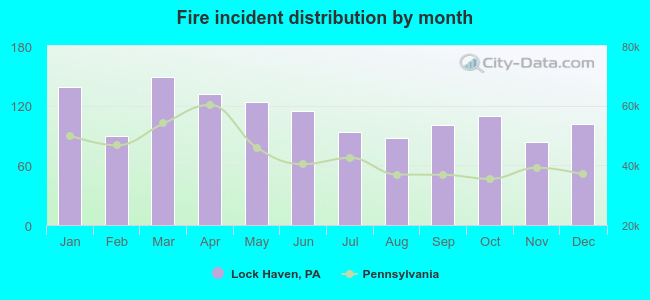 According to the 1,326 reports from years 2003 - 2018 most fires (11.2%) took place during March, and the least (6.3%) in November.
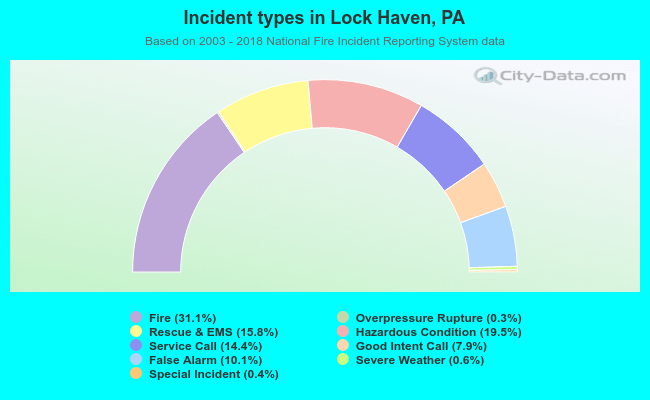 Out of all 4,262 cases reported during the years 2003 - 2018, the most belonged to the categories: Fire (31.1%), Hazardous Condition (19.5%), and Rescue & EMS (15.8%).
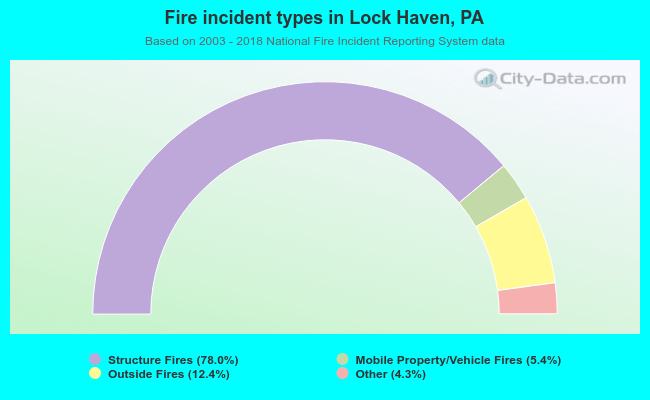 When looking into fire subcategories, the most reports belonged to: Structure Fires (78.0%), and Outside Fires (12.4%).