Lincolnshire: Fire Incidents, Illinois (IL)
Where are fire incidents reported in Lincolnshire, IL
Something went wrong! Please refresh the page.
| Fire incidents reported | |
|---|---|
| Sreet name | Count |
| SCHELTER RD | 340 |
| SCHELTER ROAD | 152 |
| OUT OF DISTRICT | 44 |
| MILWAUKEE AVE | 38 |
| PARKWAY DR | 36 |
| MARRIOTT DR | 24 |
| ELM RD | 20 |
| HALF DAY RD | 18 |
| INDUSTRIAL LANE | 18 |
| MILWAUKEE | 18 |
| RIVERSHIRE LN | 18 |
| MILWAUKEE AV | 14 |
| PLYMOUTH CT | 14 |
| RIVERWOODS RD | 14 |
| SCHELTER | 14 |
| BOND ST | 12 |
| OVERLOOK PT | 12 |
| RIVERWOODS ROAD | 12 |
| SHELTER | 12 |
| APTAKISIC RD | 10 |
| MARRIOTT DRIVE | 10 |
| MUTUAL AID STREET | 10 |
| OLD HALF DAY RD | 10 |
| BARCLAY BLVD | 8 |
| CAMBRIDGE LN | 8 |
| ELSINOOR DR | 8 |
| ESSEX LN | 8 |
| FRIAR TUCK CT | 8 |
| INDIAN CREEK RD | 8 |
| OVERLOOK POINT | 8 |
2002 - 2018 National Fire Incident Reporting System (NFIRS) incidents
- Incident types reported to NFIRS in Lincolnshire, IL
- 6,10855.1%Rescue & EMS
- 1,80316.3%False Alarm
- 9979.0%Service Call
- 7847.1%Hazardous Condition
- 7126.4%Fire
- 6505.9%Good Intent Call
- 170.2%Overpressure Rupture
- Fire incident types reported to NFIRS in Lincolnshire, IL
- 47166.2%Structure Fires
- 10514.7%Outside Fires
- 8712.2%Other
- 496.9%Mobile Property/Vehicle Fires
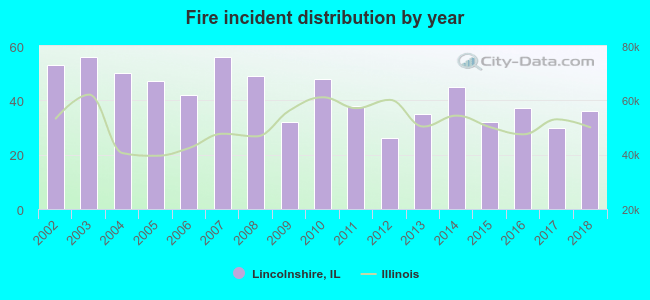 According to the data from the years 2002 - 2018 the average number of fires per year is 42. The highest number of fires - 56 took place in 2003, and the least - 26 in 2012. The data has a dropping trend.
The average number of yearly fire incidents per 10k residents in Lincolnshire, IL compared to nearest cities:
(Note: Based on data for the last 3 years, including only cities with population 5,000 and above)
| Lincolnshire: | 47.1 |
| Buffalo Grove: | 20.4 |
| Vernon Hills: | 18.4 |
| Deerfield: | 26.5 |
| Lake Forest: | 29.4 |
| Wheeling: | 19.4 |
| Long Grove: | 40.7 |
| Highwood: | 11.8 |
| Highland Park: | 14.4 |
 The median response time based on all reported fire incidents is 4 minutes. This is lower compared to the Illinois median value.
The median response time in Lincolnshire, IL compared to nearest cities:
(Note: Based on data for all years, including only cities with at least 500 fire incidents)
| Lincolnshire: | 4 minutes |
| Buffalo Grove: | 5 minutes |
| Vernon Hills: | 5 minutes |
| Deerfield: | 5 minutes |
| Lake Forest: | 6 minutes |
| Wheeling: | 5 minutes |
| Long Grove: | 7 minutes |
| Highland Park: | 4 minutes |
| Northbrook: | 5 minutes |
 Based on the data from the years 2002 - 2018 the average number of fire-related yearly casualties is 0. The highest number of reported injuries - 2 took place in 2003, and the lowest - 0 in 2002. The data has a constant trend.
The average number of casualties per 1,000 fires is 8. This indicator was the highest - 48 in 2006, and the lowest 0 in 2002. The trend for injuries per 1,000 fire incidents is constant. Compared to the Illinois value the number of casualties per 1,000 fire incidents is lower.
Based on the data from the years 2002 - 2018 the average number of fire-related yearly casualties is 0. The highest number of reported injuries - 2 took place in 2003, and the lowest - 0 in 2002. The data has a constant trend.
The average number of casualties per 1,000 fires is 8. This indicator was the highest - 48 in 2006, and the lowest 0 in 2002. The trend for injuries per 1,000 fire incidents is constant. Compared to the Illinois value the number of casualties per 1,000 fire incidents is lower.Casualties per 1,000 incidents in Lincolnshire, IL compared to nearest cities:
(Note: Based on data for all years, including only cities with at least 500 fire incidents)
| Lincolnshire: | 8.4 |
| Buffalo Grove: | 19.4 |
| Vernon Hills: | 25.7 |
| Deerfield: | 16.6 |
| Lake Forest: | 27.7 |
| Wheeling: | 57.3 |
| Long Grove: | 45.5 |
| Highland Park: | 15.8 |
| Northbrook: | 17.2 |
 44.7% incidents where reported in the morning and 55.3% in the evening. The most fires (18.3%) took place on Monday, and the least (10.7%) on Friday.
 Based on the 712 incident reports from years 2002 - 2018 most fires (11.2%) took place during May, and the least (5.2%) in December.
 Out of all 11,078 cases reported during the years 2002 - 2018, the most belonged to the categories: Rescue & EMS (55.1%), False Alarm (16.3%), and Service Call (9.0%).
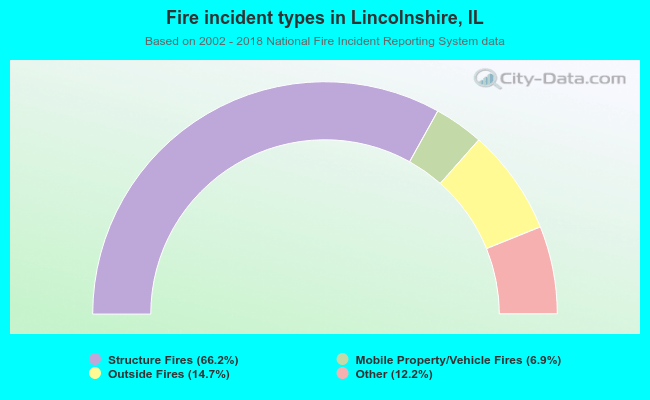 When looking into fire subcategories, the most reports belonged to: Structure Fires (66.2%), and Outside Fires (14.7%).