Leavenworth: Fire Incidents, Kansas (KS)
Where are fire incidents reported in Leavenworth, KS
Something went wrong! Please refresh the page.
| Fire incidents reported | |
|---|---|
| Sreet name | Count |
| 4TH ST | 220 |
| OTTAWA ST | 140 |
| SHAWNEE ST | 140 |
| DAKOTA ST | 110 |
| OSAGE ST | 98 |
| 10TH AVE | 96 |
| SPRUCE ST | 96 |
| 2ND ST | 88 |
| BROADWAY ST | 86 |
| CHEROKEE ST | 76 |
| DELAWARE ST | 76 |
| LIMIT ST | 70 |
| 187TH ST | 68 |
| POTTAWATOMIE ST | 66 |
| 7TH ST | 60 |
| KIOWA ST | 58 |
| 10TH ST | 56 |
| MARTIN LUTHER KING DR | 54 |
| 5TH ST | 52 |
| CHEYENNE ST | 48 |
| METROPOLITAN AVE | 48 |
| VILAS ST | 48 |
| MIAMI ST | 46 |
| SENECA ST | 44 |
| 5TH AVE | 42 |
| PAWNEE ST | 42 |
| SPRINGDALE RD | 42 |
| 2ND AVE | 40 |
| 3RD AVE | 40 |
| EISENHOWER RD | 40 |
| Other | 355 |
2002 - 2018 National Fire Incident Reporting System (NFIRS) incidents
- Incident types reported to NFIRS in Leavenworth, KS
- 7,79945.9%Rescue & EMS
- 3,60521.2%Hazardous Condition
- 2,54515.0%Fire
- 1,1947.0%False Alarm
- 9345.5%Good Intent Call
- 8505.0%Service Call
- 490.3%Overpressure Rupture
- Fire incident types reported to NFIRS in Leavenworth, KS
- 1,10843.5%Outside Fires
- 1,00739.6%Structure Fires
- 39115.4%Mobile Property/Vehicle Fires
- 391.5%Other
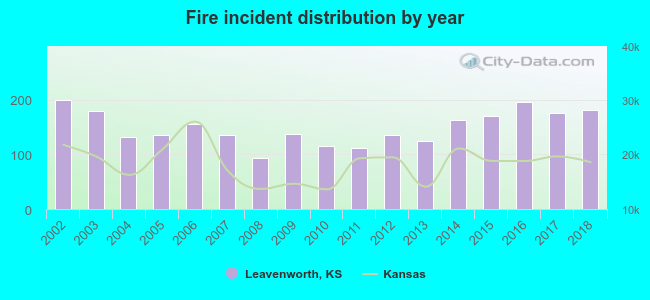 According to the data from the years 2002 - 2018 the average number of fires per year is 150. The highest number of fires - 199 took place in 2002, and the least - 94 in 2008. The data has a declining trend.
The average number of yearly fire incidents per 10k residents in Leavenworth, KS compared to nearest cities:
(Note: Based on data for the last 3 years, including only cities with population 5,000 and above)
| Leavenworth: | 51.2 |
| Lansing: | 30.2 |
| Basehor: | 108.7 |
| Tonganoxie: | 213.8 |
| Bonner Springs: | 50.3 |
| Kansas City: | 42.0 |
| Atchison: | 40.5 |
| Shawnee: | 23.6 |
| Merriam: | 38.7 |
 The median response time based on all reported fire incidents is 4 minutes. This is lower than the Kansas median value.
The median response time in Leavenworth, KS compared to nearest cities:
(Note: Based on data for all years, including only cities with at least 500 fire incidents)
| Leavenworth: | 4 minutes |
| Lansing: | 6 minutes |
| Basehor: | 7 minutes |
| Tonganoxie: | 10 minutes |
| Bonner Springs: | 8 minutes |
| McLouth: | 12 minutes |
| Kansas City: | 5 minutes |
| Atchison: | 4 minutes |
| Oskaloosa: | 12 minutes |
 Based on the data from the years 2002 - 2018 the average number of fire-related yearly deaths is 0. The highest number of deaths - 2 took place in 2018, and the lowest - 0 in 2002. The data has a growing trend.
The average number of deaths per 1,000 fire incidents is 1. This indicator was the highest - 11 in 2018, and the lowest 0 in 2002. The trend for fatalities per 1,000 fire incidents is growing. Compared to the state value the number of fatalities per 1,000 fires is lower.
Based on the data from the years 2002 - 2018 the average number of fire-related yearly deaths is 0. The highest number of deaths - 2 took place in 2018, and the lowest - 0 in 2002. The data has a growing trend.
The average number of deaths per 1,000 fire incidents is 1. This indicator was the highest - 11 in 2018, and the lowest 0 in 2002. The trend for fatalities per 1,000 fire incidents is growing. Compared to the state value the number of fatalities per 1,000 fires is lower.Deaths per 1,000 incidents in Leavenworth, KS compared to nearest cities:
(Note: Based on data for all years, including only cities with at least 2,500 fire incidents)
| Leavenworth: | 1.6 |
| Kansas City: | 4.0 |
| Lenexa: | 2.4 |
| Overland Park: | 3.3 |
| Lawrence: | 0.5 |
| Olathe: | 2.9 |
 According to the reports from the years 2002 - 2018 the average number of fire-related casualties per year is 4. The highest number of injuries - 8 took place in 2002, and the lowest - 0 in 2012. The data has a declining trend.
The average number of injuries per 1,000 fire incidents is 25. This indicator was the highest - 52 in 2010, and the lowest 0 in 2012. The trend for casualties per 1,000 fire incidents is declining. Compared to the state value the number of casualties per 1,000 fires is much higher.
According to the reports from the years 2002 - 2018 the average number of fire-related casualties per year is 4. The highest number of injuries - 8 took place in 2002, and the lowest - 0 in 2012. The data has a declining trend.
The average number of injuries per 1,000 fire incidents is 25. This indicator was the highest - 52 in 2010, and the lowest 0 in 2012. The trend for casualties per 1,000 fire incidents is declining. Compared to the state value the number of casualties per 1,000 fires is much higher.Casualties per 1,000 incidents in Leavenworth, KS compared to nearest cities:
(Note: Based on data for all years, including only cities with at least 500 fire incidents)
| Leavenworth: | 24.8 |
| Lansing: | 18.6 |
| Basehor: | 1.1 |
| Tonganoxie: | 0.5 |
| Bonner Springs: | 5.5 |
| McLouth: | 2.3 |
| Kansas City: | 13.3 |
| Atchison: | 18.4 |
| Oskaloosa: | 0.0 |
 28.6% incidents where reported in the morning and 71.4% in the evening. The most fires (16.2%) took place on Saturday, and the least (12.8%) on Wednesday.
 Based on the 2,545 reports from years 2002 - 2018 most fires (15.2%) took place during March, and the least (6.2%) in May.
 Out of all 16,995 cases reported during the years 2002 - 2018, the most belonged to the categories: Rescue & EMS (45.9%), Hazardous Condition (21.2%), and Fire (15.0%).
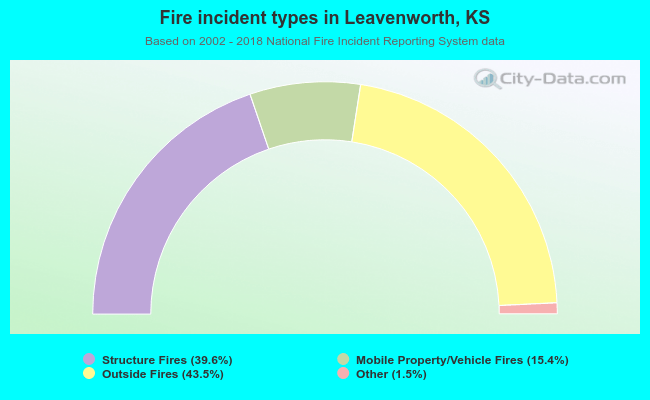 When looking into fire subcategories, the most incidents belonged to: Outside Fires (43.5%), and Structure Fires (39.6%).