Lawrenceburg: Fire Incidents, Tennessee (TN)
Where are fire incidents reported in Lawrenceburg, TN
Something went wrong! Please refresh the page.
| Fire incidents reported | |
|---|---|
| Sreet name | Count |
| LOCUST AVE | 178 |
| GAINES ST | 108 |
| WAYNESBORO HWY | 92 |
| BUFFALO RD | 78 |
| THIRD ST | 52 |
| WEAKLEY CREEK RD | 52 |
| MAHR AVE | 50 |
| MILITARY AVE | 48 |
| OLD FLORENCE RD | 36 |
| TURNPIKE RD | 34 |
| FALL RIVER RD | 32 |
| LIBERTY AVE | 32 |
| ROBERTS AVE | 32 |
| WATERLOO RD | 32 |
| WEST POINT RD | 32 |
| SIXTH ST | 30 |
| WATERLOO RD | 30 |
| GIMLET RD | 28 |
| GRANDADDY RD | 28 |
| HOOD RD | 28 |
| SECOND ST | 28 |
| SPRINGER RD | 28 |
| HWY 43 HWY | 26 |
| WESTPOINT RD | 26 |
| BIG SPRINGS RD | 22 |
| BUTTERMILK RIDGE RD | 22 |
| CLAYMAR DR | 22 |
| FIFTH ST | 22 |
| HY 64W | 22 |
| MARABLE RD | 22 |
| Other | 1,214 |
2002 - 2018 National Fire Incident Reporting System (NFIRS) incidents
- Incident types reported to NFIRS in Lawrenceburg, TN
- 8,73648.4%Rescue & EMS
- 2,50913.9%Hazardous Condition
- 2,48613.8%Fire
- 1,99811.1%Service Call
- 1,5358.5%Good Intent Call
- 6643.7%False Alarm
- 870.5%Special Incident
- Fire incident types reported to NFIRS in Lawrenceburg, TN
- 1,15846.6%Structure Fires
- 93337.5%Outside Fires
- 30712.3%Mobile Property/Vehicle Fires
- 883.5%Other
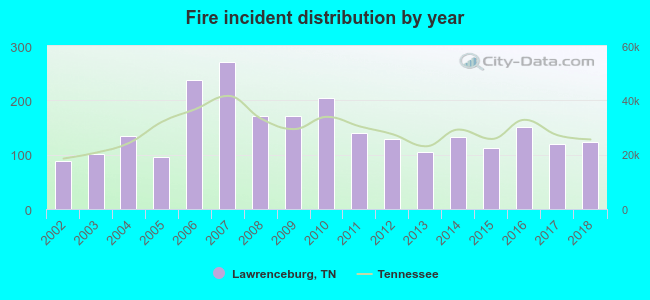 According to the data from the years 2002 - 2018 the average number of fire incidents per year is 146. The highest number of fires - 270 took place in 2007, and the least - 89 in 2002. The data has a rising trend.
The average number of yearly fire incidents per 10k residents in Lawrenceburg, TN compared to nearest cities:
(Note: Based on data for the last 3 years, including only cities with population 5,000 and above)
| Lawrenceburg: | 124.8 |
| Pulaski: | 124.6 |
| Columbia: | 50.7 |
| Lewisburg: | 88.2 |
| Spring Hill: | 17.9 |
| Fayetteville: | 83.1 |
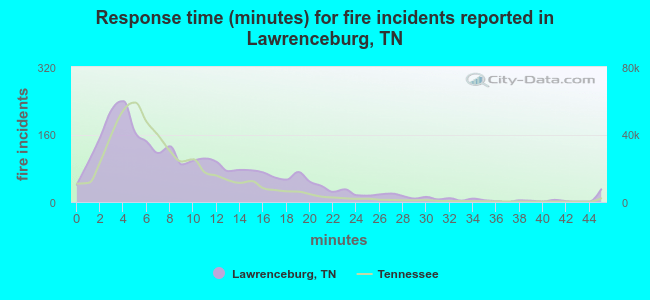 The median response time based on all reported fire incidents is 8 minutes. This is higher compared to the Tennessee median value.
The median response time in Lawrenceburg, TN compared to nearest cities:
(Note: Based on data for all years, including only cities with at least 500 fire incidents)
| Lawrenceburg: | 8 minutes |
| Leoma: | 12 minutes |
| Summertown: | 11 minutes |
| Pulaski: | 9 minutes |
| Waynesboro: | 15 minutes |
| Hohenwald: | 7 minutes |
| Columbia: | 5 minutes |
| Lewisburg: | 6 minutes |
| Florence: | 5 minutes |
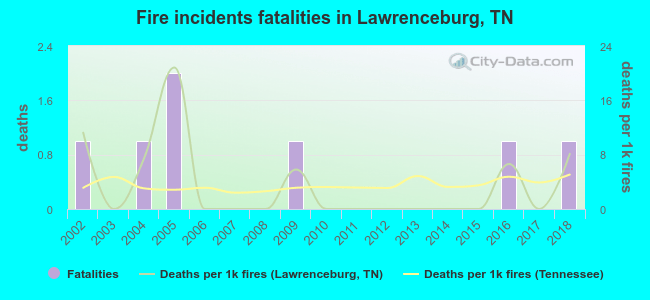 Based on the reports from the years 2002 - 2018 the average number of fire-related fatalities per year is 0. The highest number of deaths - 2 took place in 2005, and the lowest - 0 in 2003. The data has a constant trend.
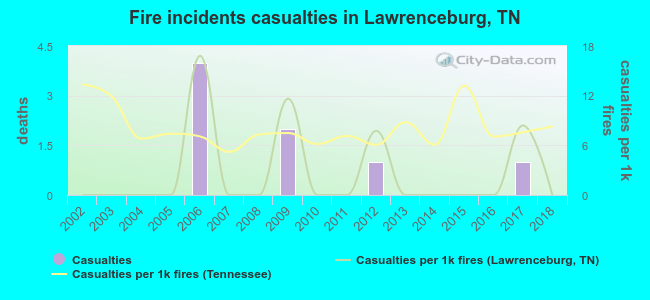 According to the reports from the years 2002 - 2018 the average number of fire-related yearly casualties is 0. The highest number of reported casualties - 4 took place in 2006, and the lowest - 0 in 2002. The data has a constant trend.
The average number of injuries per 1,000 fire incidents is 3. This indicator was the highest - 17 in 2006, and the lowest 0 in 2002. The trend for injuries per 1,000 incidents is constant. Compared to the Tennessee value the number of injuries per 1,000 fires is much lower.
According to the reports from the years 2002 - 2018 the average number of fire-related yearly casualties is 0. The highest number of reported casualties - 4 took place in 2006, and the lowest - 0 in 2002. The data has a constant trend.
The average number of injuries per 1,000 fire incidents is 3. This indicator was the highest - 17 in 2006, and the lowest 0 in 2002. The trend for injuries per 1,000 incidents is constant. Compared to the Tennessee value the number of injuries per 1,000 fires is much lower.Casualties per 1,000 incidents in Lawrenceburg, TN compared to nearest cities:
(Note: Based on data for all years, including only cities with at least 500 fire incidents)
| Lawrenceburg: | 3.2 |
| Leoma: | 0.0 |
| Summertown: | 3.2 |
| Pulaski: | 2.5 |
| Waynesboro: | 1.6 |
| Hohenwald: | 9.1 |
| Columbia: | 12.1 |
| Lewisburg: | 2.4 |
| Florence: | 4.2 |
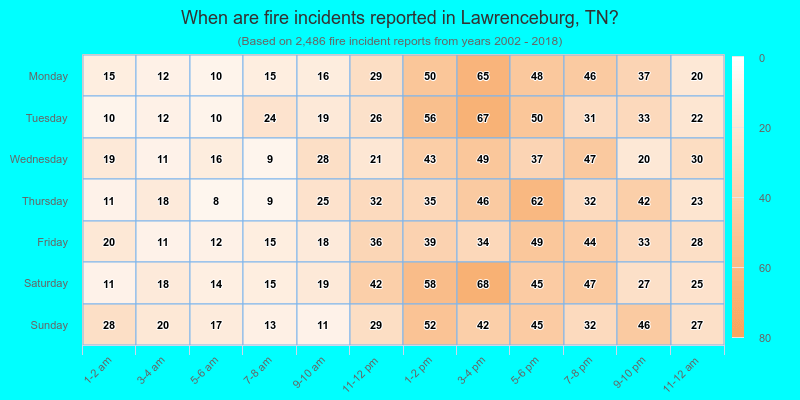
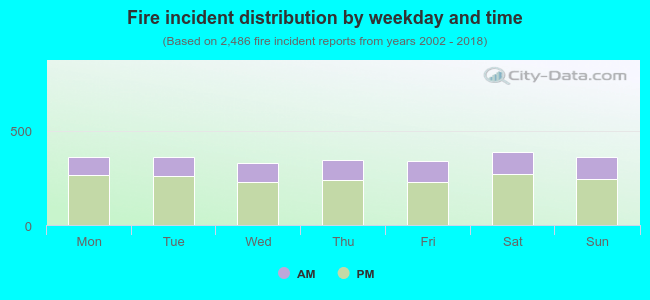 30.3% incidents where reported in the morning and 69.7% in the evening. The most fires (15.6%) took place on Saturday, and the least (13.3%) on Wednesday.
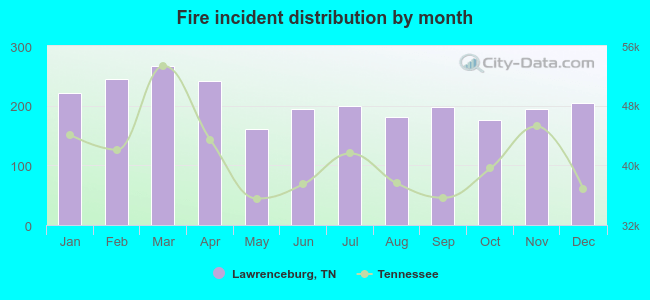 According to the 2,486 fire incident reports from years 2002 - 2018 most fires (10.7%) took place during March, and the least (6.5%) in May.
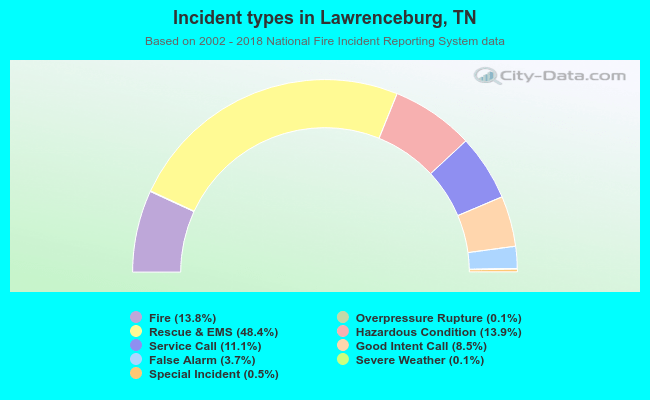 Out of all 18,047 cases reported during the years 2002 - 2018, the most belonged to the categories: Rescue & EMS (48.4%), Hazardous Condition (13.9%), and Fire (13.8%).
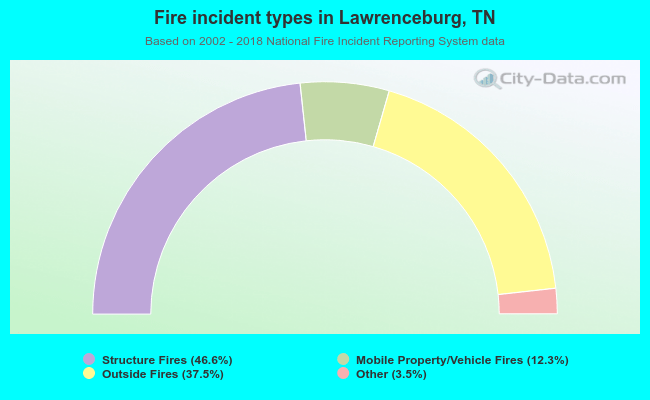 When looking into fire subcategories, the most incidents belonged to: Structure Fires (46.6%), and Outside Fires (37.5%).