Lansdale: Fire Incidents, Pennsylvania (PA)
Where are fire incidents reported in Lansdale, PA
Something went wrong! Please refresh the page.
|
| |||||||||||||||||||||||||||||||||||||||||||||||||||||||||||||||||||||||||||||||||||||||||||||||||||||||||||||
2004 - 2018 National Fire Incident Reporting System (NFIRS) incidents
- Incident types reported to NFIRS in Lansdale, PA
- 43334.4%Fire
- 36328.8%Hazardous Condition
- 15112.0%False Alarm
- 13410.6%Rescue & EMS
- 917.2%Good Intent Call
- 786.2%Service Call
- 80.6%Special Incident
- Fire incident types reported to NFIRS in Lansdale, PA
- 25458.7%Structure Fires
- 10023.1%Outside Fires
- 5212.0%Mobile Property/Vehicle Fires
- 276.2%Other
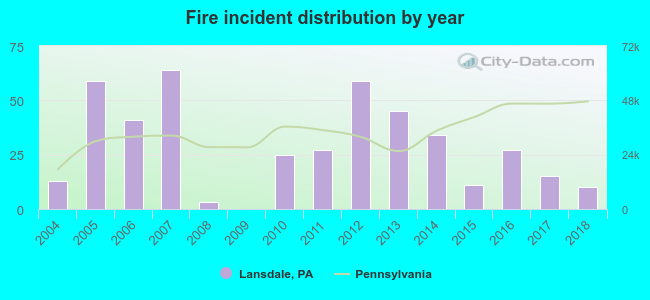 According to the data from the years 2004 - 2018 the average number of fires per year is 29. The highest number of fire incidents - 64 took place in 2007, and the least - 0 in 2009. The data has a dropping trend.
The average number of yearly fire incidents per 10k residents in Lansdale, PA compared to nearest cities:
(Note: Based on data for the last 3 years, including only cities with population 5,000 and above)
| Lansdale: | 10.5 |
| Montgomeryville: | 26.9 |
| Souderton: | 31.2 |
| Harleysville: | 12.9 |
| Blue Bell: | 16.5 |
| Ambler: | 37.4 |
| East Norriton: | 30.3 |
| Maple Glen: | 3.0 |
| Fort Washington: | 36.1 |
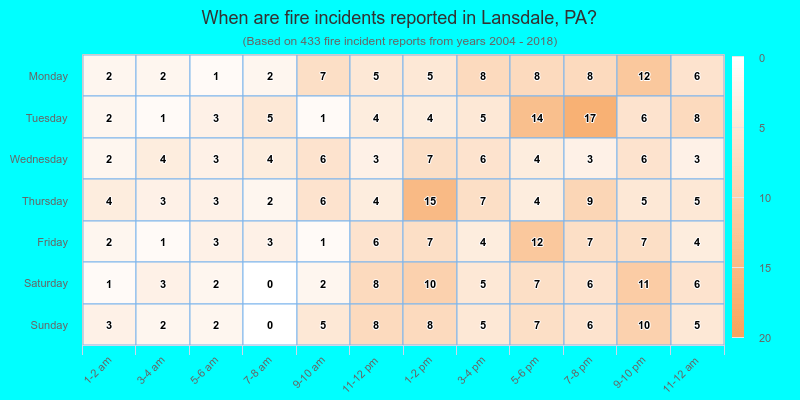
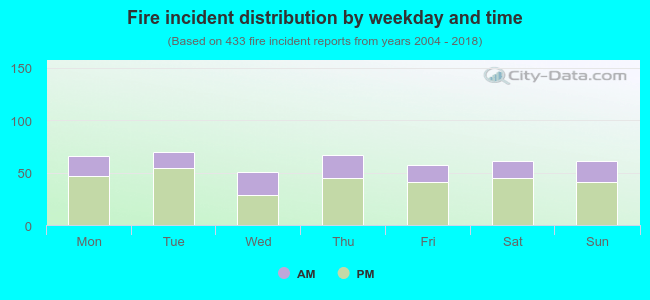 30.3% incidents where reported in the morning and 69.7% in the evening. The most fires (16.2%) took place on Tuesday, and the least (11.8%) on Wednesday.
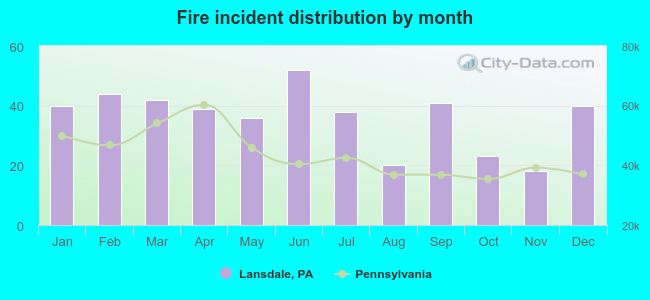 According to the 433 fire incidents from years 2004 - 2018 most fires (12.0%) took place during June, and the least (4.2%) in November.
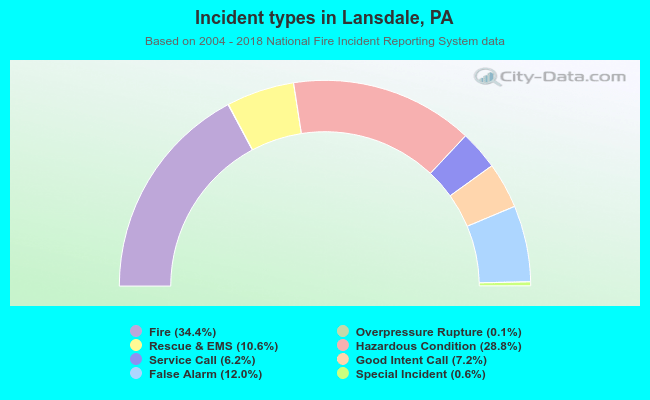 Out of all 1,259 cases reported during the years 2004 - 2018, the most belonged to the categories: Fire (34.4%), Hazardous Condition (28.8%), and False Alarm (12.0%).
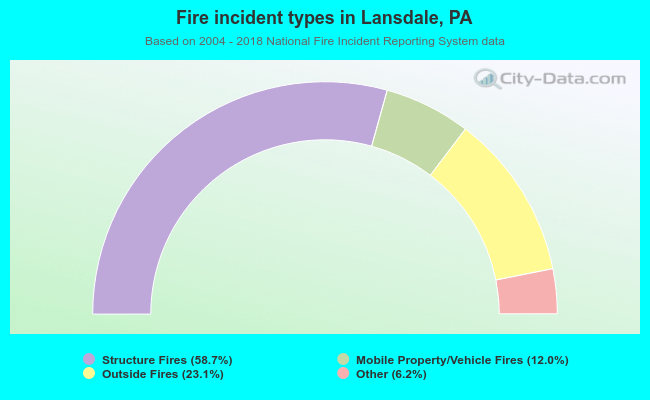 When looking into fire subcategories, the most incidents belonged to: Structure Fires (58.7%), and Outside Fires (23.1%).