Lanett: Fire Incidents, Alabama (AL)
Where are fire incidents reported in Lanett, AL
Something went wrong! Please refresh the page.
|
| |||||||||||||||||||||||||||||||||||||||||||||||||||||||||||||||||||||||||||||||||||||||||||||||||||||||||||||
2004 - 2018 National Fire Incident Reporting System (NFIRS) incidents
- Incident types reported to NFIRS in Lanett, AL
- 38236.7%Fire
- 22922.0%Good Intent Call
- 14513.9%False Alarm
- 11010.6%Rescue & EMS
- 10410.0%Hazardous Condition
- 615.9%Service Call
- 50.5%Overpressure Rupture
- 50.5%Severe Weather
- Fire incident types reported to NFIRS in Lanett, AL
- 24263.4%Structure Fires
- 8020.9%Outside Fires
- 359.2%Other
- 256.5%Mobile Property/Vehicle Fires
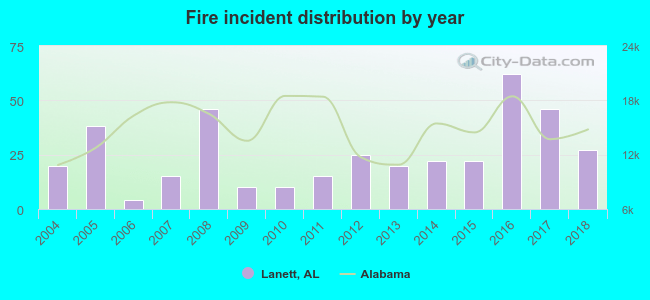 Based on the data from the years 2004 - 2018 the average number of fire incidents per year is 25. The highest number of reported fires - 62 took place in 2016, and the least - 4 in 2006. The data has a rising trend.
The average number of yearly fire incidents per 10k residents in Lanett, AL compared to nearest cities:
(Note: Based on data for the last 3 years, including only cities with population 5,000 and above)
| Lanett: | 69.8 |
| Valley: | 43.0 |
| Beulah: | 1.6 |
| Opelika: | 39.8 |
| Roanoke: | 32.7 |
| Smiths Station: | 80.0 |
| Smiths: | 13.9 |
| Auburn: | 24.6 |
| Phenix City: | 37.5 |

 35.6% incidents where reported in the morning and 64.4% in the evening. The most fires (17.5%) took place on Monday, and the least (10.2%) on Tuesday.
 Based on the 382 reports from years 2004 - 2018 most fires (13.1%) took place during March, and the least (4.5%) in September.
 Out of all 1,042 cases reported during the years 2004 - 2018, the most belonged to the categories: Fire (36.7%), Good Intent Call (22.0%), and False Alarm (13.9%).
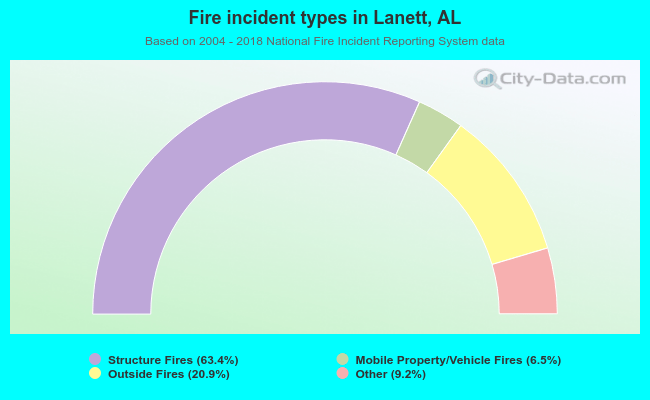 When looking into fire subcategories, the most incidents belonged to: Structure Fires (63.4%), and Outside Fires (20.9%).