Lake City: Fire Incidents, South Carolina (SC)
Where are fire incidents reported in Lake City, SC
Something went wrong! Please refresh the page.
| Fire incidents reported | |
|---|---|
| Sreet name | Count |
| MAIN ST | 96 |
| MORRIS ST | 88 |
| RON MCNAIR BLVD | 64 |
| MOORE ST | 60 |
| OLD GEORGETOWN RD | 54 |
| BEULAH RD | 50 |
| GREEN RD | 48 |
| CHURCH ST | 46 |
| RAE ST | 42 |
| WALLACE ST | 34 |
| AIRPORT CIR | 32 |
| MATTHEWS RD | 32 |
| THOMAS ST | 32 |
| WESTOVER ST | 32 |
| TURBEVILLE HWY | 30 |
| CEDAR ST | 28 |
| COOKTOWN RD | 28 |
| HUGGINS RD | 28 |
| JOHNSONVILLE HWY | 28 |
| CREEK RD | 26 |
| BURNT BRANCH RD | 24 |
| INDIANTOWN RD | 22 |
| ACLINE ST | 20 |
| BARRINEAU RD | 20 |
| DAVIS ST | 20 |
| DENNIS RD | 20 |
| DEWEY COX RD | 18 |
| GRAHAM RD | 18 |
| GREEN HAVEN AVE | 18 |
| KOGER CIR | 18 |
| Other | 412 |
2003 - 2018 National Fire Incident Reporting System (NFIRS) incidents
- Incident types reported to NFIRS in Lake City, SC
- 2,02136.9%Rescue & EMS
- 1,48827.1%Fire
- 76514.0%Hazardous Condition
- 55510.1%Good Intent Call
- 4718.6%False Alarm
- 1562.8%Service Call
- 180.3%Severe Weather
- 60.1%Special Incident
- Fire incident types reported to NFIRS in Lake City, SC
- 65944.3%Outside Fires
- 59540.0%Structure Fires
- 21714.6%Mobile Property/Vehicle Fires
- 171.1%Other
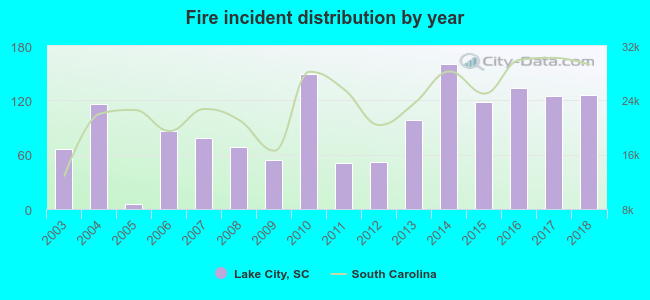 Based on the data from the years 2003 - 2018 the average number of fire incidents per year is 93. The highest number of reported fires - 160 took place in 2014, and the least - 6 in 2005. The data has a growing trend.
The average number of yearly fire incidents per 10k residents in Lake City, SC compared to nearest cities:
(Note: Based on data for the last 3 years, including only cities with population 5,000 and above)
| Lake City: | 190.6 |
| Florence: | 126.4 |
| Marion: | 88.9 |
| Darlington: | 247.1 |
| Sumter: | 169.2 |
| Hartsville: | 310.7 |
| Conway: | 147.9 |
| Georgetown: | 172.3 |
| Dillon: | 6.5 |
 The median response time based on all reported fire incidents is 5 minutes. This is lower than the South Carolina median value.
The median response time in Lake City, SC compared to nearest cities:
(Note: Based on data for all years, including only cities with at least 500 fire incidents)
| Lake City: | 5 minutes |
| Kingstree: | 7 minutes |
| Hemingway: | 10 minutes |
| Florence: | 6 minutes |
| Lynchburg: | 11 minutes |
| Manning: | 7 minutes |
| Marion: | 6 minutes |
| Darlington: | 6 minutes |
| Aynor: | 8 minutes |
 According to the data from the years 2003 - 2018 the average number of fire-related yearly deaths is 0. The highest number of deaths - 2 took place in 2016, and the lowest - 0 in 2003. The data has a rising trend.
 Based on the reports from the years 2003 - 2018 the average number of fire-related casualties per year is 0. The highest number of casualties - 1 took place in 2009, and the lowest - 0 in 2003. The data has a constant trend.
The average number of casualties per 1,000 fires is 3. This indicator was the highest - 19 in 2009, and the lowest 0 in 2003. The trend for injuries per 1,000 incidents is constant. Compared to the South Carolina value the number of injuries per 1,000 incidents is much lower.
Based on the reports from the years 2003 - 2018 the average number of fire-related casualties per year is 0. The highest number of casualties - 1 took place in 2009, and the lowest - 0 in 2003. The data has a constant trend.
The average number of casualties per 1,000 fires is 3. This indicator was the highest - 19 in 2009, and the lowest 0 in 2003. The trend for injuries per 1,000 incidents is constant. Compared to the South Carolina value the number of injuries per 1,000 incidents is much lower.
 26.9% incidents where reported in the morning and 73.1% in the evening. The most fires (15.1%) took place on Friday, and the least (12.2%) on Wednesday.
 According to the 1,488 fires from years 2003 - 2018 most fires (13.2%) took place during March, and the least (6.1%) in August.
 Out of all 5,482 cases reported during the years 2003 - 2018, the most belonged to the categories: Rescue & EMS (36.9%), Fire (27.1%), and Hazardous Condition (14.0%).
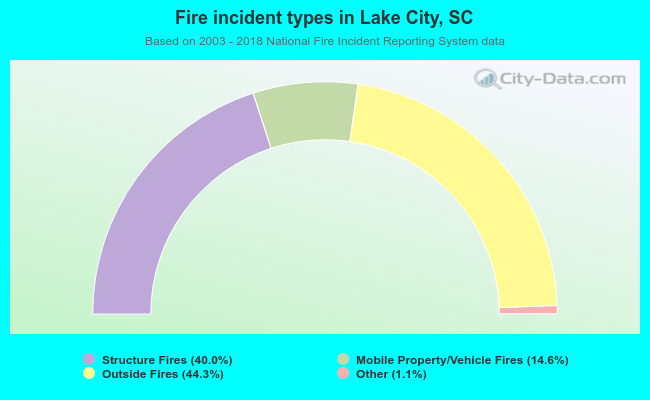 When looking into fire subcategories, the most incidents belonged to: Outside Fires (44.3%), and Structure Fires (40.0%).