Lady Lake: Fire Incidents, Florida (FL)
Where are fire incidents reported in Lady Lake, FL
Something went wrong! Please refresh the page.
| Fire incidents reported | |
|---|---|
| Sreet name | Count |
| GRIFFIN AVE | 62 |
| 466 | 60 |
| GRAYS AIRPORT RD | 58 |
| LAKE GRIFFIN RD | 58 |
| MARION COUNTY RD | 52 |
| GRIFFIN VIEW DR | 48 |
| CR 25 | 38 |
| HWY 27/441 | 36 |
| ROLLING ACRES RD | 34 |
| 27441 | 32 |
| CR 466 | 32 |
| BICHARA BLVD | 28 |
| HWY 466 | 26 |
| AVENIDA CENTRAL | 22 |
| GENIUS CT | 22 |
| HOBBY WY | 22 |
| HOBBY WAY | 20 |
| HWY 27441 | 20 |
| MAIN ST | 20 |
| HWY 27 | 18 |
| 441 HWY | 16 |
| HAPPY LN | 16 |
| LADY LAKE BLVD | 16 |
| SKYLINE DR | 16 |
| 27 HWY | 14 |
| LEMON ST | 14 |
| RAINBOW BLVD | 14 |
| ROSE LN | 14 |
| SUMMIT ST | 14 |
| US HWY 441-27 | 14 |
| Other | 479 |
2002 - 2018 National Fire Incident Reporting System (NFIRS) incidents
- Incident types reported to NFIRS in Lady Lake, FL
- 17,23670.9%Rescue & EMS
- 2,56010.5%Service Call
- 1,7567.2%Good Intent Call
- 1,3355.5%Fire
- 7142.9%False Alarm
- 6292.6%Hazardous Condition
- 580.2%Special Incident
- Fire incident types reported to NFIRS in Lady Lake, FL
- 62146.5%Outside Fires
- 48036.0%Structure Fires
- 17313.0%Mobile Property/Vehicle Fires
- 614.6%Other
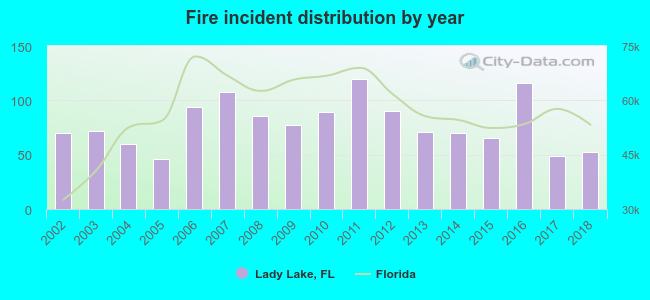 Based on the data from the years 2002 - 2018 the average number of fires per year is 79. The highest number of fire incidents - 120 took place in 2011, and the least - 46 in 2005. The data has a decreasing trend.
The average number of yearly fire incidents per 10k residents in Lady Lake, FL compared to nearest cities:
(Note: Based on data for the last 3 years, including only cities with population 5,000 and above)
| Lady Lake: | 50.0 |
| The Villages: | 6.6 |
| Wildwood: | 141.6 |
| Leesburg: | 110.9 |
| Tavares: | 64.1 |
| Eustis: | 66.1 |
| Mount Dora: | 58.9 |
| Ocala: | 141.4 |
| Mascotte: | 58.0 |
 The median response time based on all reported fire incidents is 7 minutes. This is similar to the Florida median value.
The median response time in Lady Lake, FL compared to nearest cities:
(Note: Based on data for all years, including only cities with at least 500 fire incidents)
| Lady Lake: | 7 minutes |
| The Villages: | 5 minutes |
| Fruitland Park: | 7 minutes |
| Wildwood: | 8 minutes |
| Leesburg: | 7 minutes |
| Belleview: | 8 minutes |
| Tavares: | 6 minutes |
| Eustis: | 7 minutes |
| Umatilla: | 9 minutes |
 Based on the reports from the years 2002 - 2018 the average number of fire-related yearly casualties is 0. The highest number of reported casualties - 1 took place in 2010, and the lowest - 0 in 2002. The data has a constant trend.
The average number of casualties per 1,000 fires is 3. This indicator was the highest - 14 in 2014, and the lowest 0 in 2002. The trend for casualties per 1,000 incidents is constant. Compared to the Florida value the number of injuries per 1,000 fires is much lower.
Based on the reports from the years 2002 - 2018 the average number of fire-related yearly casualties is 0. The highest number of reported casualties - 1 took place in 2010, and the lowest - 0 in 2002. The data has a constant trend.
The average number of casualties per 1,000 fires is 3. This indicator was the highest - 14 in 2014, and the lowest 0 in 2002. The trend for casualties per 1,000 incidents is constant. Compared to the Florida value the number of injuries per 1,000 fires is much lower.Casualties per 1,000 incidents in Lady Lake, FL compared to nearest cities:
(Note: Based on data for all years, including only cities with at least 500 fire incidents)
| Lady Lake: | 3.0 |
| The Villages: | 6.6 |
| Fruitland Park: | 2.4 |
| Wildwood: | 6.6 |
| Leesburg: | 4.8 |
| Belleview: | 6.3 |
| Tavares: | 2.5 |
| Eustis: | 5.8 |
| Umatilla: | 0.8 |
 24.3% incidents where reported in the morning and 75.7% in the evening. The most fires (15.8%) took place on Saturday, and the least (12.3%) on Tuesday.
 Based on the 1,335 fires from years 2002 - 2018 most fires (12.8%) took place during March, and the least (6.3%) in November.
 Out of all 24,319 cases reported during the years 2002 - 2018, the most belonged to the categories: Rescue & EMS (70.9%), Service Call (10.5%), and Good Intent Call (7.2%).
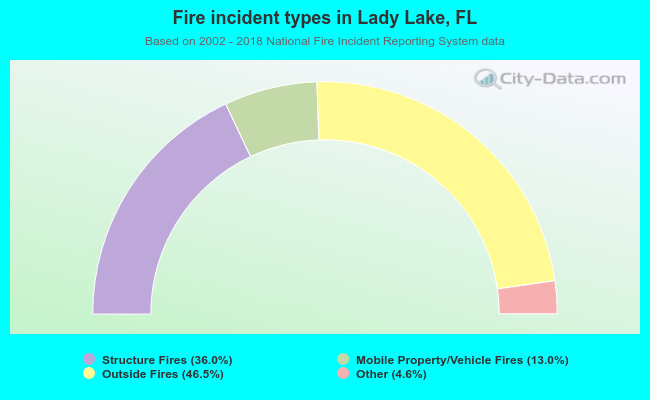 When looking into fire subcategories, the most incidents belonged to: Outside Fires (46.5%), and Structure Fires (36.0%).