La Fayette: Fire Incidents, Georgia (GA)
Where are fire incidents reported in La Fayette, GA
Something went wrong! Please refresh the page.
|
| |||||||||||||||||||||||||||||||||||||||||||||||||||||||||||||||||||||||||||||||||||||||||||||||||||||||||||||
2003 - 2016 National Fire Incident Reporting System (NFIRS) incidents
- Incident types reported to NFIRS in La Fayette, GA
- 12924.3%Fire
- 11421.5%Hazardous Condition
- 9317.5%Service Call
- 9217.3%Rescue & EMS
- 5510.4%Good Intent Call
- 407.5%False Alarm
- 40.8%Severe Weather
- 30.6%Special Incident
- 10.2%Overpressure Rupture
- Fire incident types reported to NFIRS in La Fayette, GA
- 6248.1%Outside Fires
- 3829.5%Structure Fires
- 2620.2%Mobile Property/Vehicle Fires
- 32.3%Other
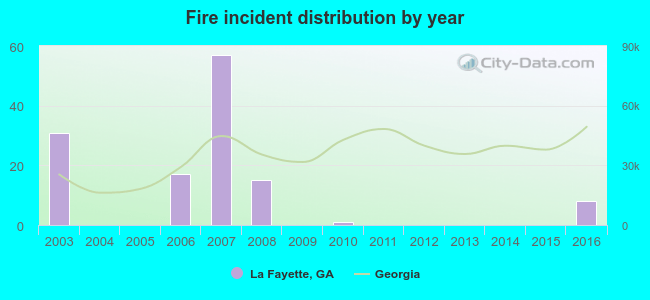 According to the data from the years 2003 - 2016 the average number of fires per year is 9. The highest number of reported fires - 57 took place in 2007, and the least - 0 in 2004. The data has a declining trend.
The average number of yearly fire incidents per 10k residents in La Fayette, GA compared to nearest cities:
(Note: Based on data for the last 3 years, including only cities with population 5,000 and above)
| La Fayette: | 11.2 |
| Fort Oglethorpe: | 35.1 |
| Dalton: | 101.5 |
| Armuchee: | 22.1 |
| Calhoun: | 39.7 |
| Rome: | 120.7 |

 20.9% incidents where reported in the morning and 79.1% in the evening. The most fires (18.6%) took place on Saturday, and the least (10.1%) on Wednesday.
 Based on the 129 reports from years 2003 - 2016 most fires (14.0%) took place during May, and the least (3.1%) in July.
 Out of all 531 cases reported during the years 2003 - 2016, the most belonged to the categories: Fire (24.3%), Hazardous Condition (21.5%), and Service Call (17.5%).
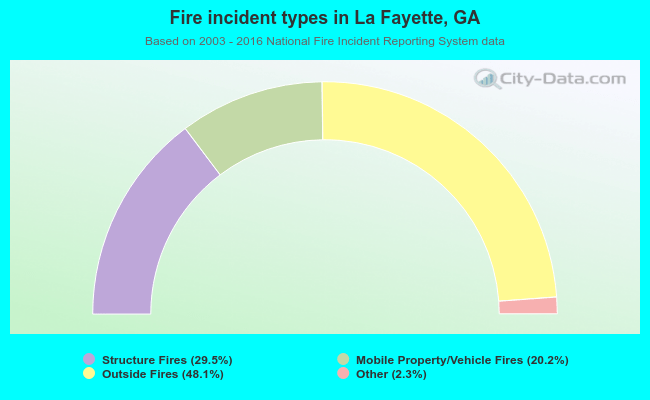 When looking into fire subcategories, the most reports belonged to: Outside Fires (48.1%), and Structure Fires (29.5%).