Kingsland: Fire Incidents, Georgia (GA)
Where are fire incidents reported in Kingsland, GA
Something went wrong! Please refresh the page.
| Fire incidents reported | |
|---|---|
| Sreet name | Count |
| KING AVE | 122 |
| CLARKS BLUFF RD | 60 |
| SCRUBBY BLUFF RD | 54 |
| GROSS RD | 46 |
| HIGHWAY 40 | 46 |
| GROVE BLVD | 40 |
| MARTIN LUTHER KING BLVD | 40 |
| BOONE AVE | 38 |
| COLERAIN RD | 38 |
| LEE ST | 34 |
| VACUNNA RD | 34 |
| ORANGE EDWARDS BLVD | 22 |
| HARRIETTS BLUFF RD | 20 |
| SEAPARC CIR | 20 |
| BOONE ST | 18 |
| HWY 17 | 16 |
| LAUREL ISLAND PKY | 16 |
| SPRINGHILL RD | 16 |
| 17 HWY | 14 |
| ESCOTT RD | 14 |
| GREENVILLE RD | 14 |
| HWY 40 | 14 |
| KINGSLAND CEMETARY RD | 14 |
| OAKHILL CHURCH RD | 14 |
| SATILLA ST | 14 |
| BROWNTOWN RD | 12 |
| LAKE MANOR DR | 12 |
| LAKE WELLINGTON DR | 12 |
| LAKES BLVD | 12 |
| LAKEWOOD DR | 12 |
| Other | 588 |
2002 - 2018 National Fire Incident Reporting System (NFIRS) incidents
- Incident types reported to NFIRS in Kingsland, GA
- 8,84861.0%Rescue & EMS
- 1,66711.5%Good Intent Call
- 1,4269.8%Fire
- 1,0167.0%Service Call
- 8986.2%Hazardous Condition
- 6154.2%False Alarm
- Fire incident types reported to NFIRS in Kingsland, GA
- 60542.4%Outside Fires
- 49334.6%Structure Fires
- 30821.6%Mobile Property/Vehicle Fires
- 201.4%Other
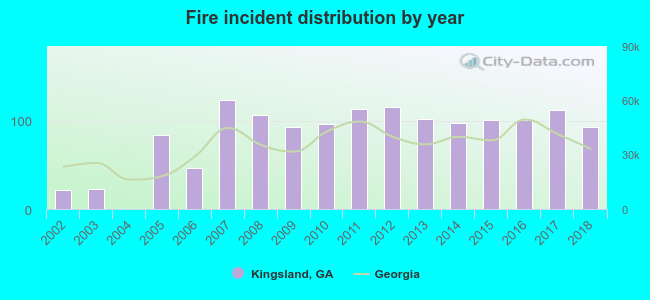 According to the data from the years 2002 - 2018 the average number of fires per year is 84. The highest number of reported fires - 123 took place in 2007, and the least - 0 in 2004. The data has a rising trend.
The average number of yearly fire incidents per 10k residents in Kingsland, GA compared to nearest cities:
(Note: Based on data for the last 3 years, including only cities with population 5,000 and above)
| Kingsland: | 62.1 |
| Folkston: | 190.8 |
| Thalmann: | 1.5 |
| Brunswick: | 190.5 |
| Dock Junction: | 2.6 |
| Waynesville: | 25.4 |
| Everett: | 0.6 |
| Waycross: | 184.5 |
| Jesup: | 59.0 |
 The median response time based on all reported fire incidents is 5 minutes. This is lower compared to the Georgia median value.
The median response time in Kingsland, GA compared to nearest cities:
(Note: Based on data for all years, including only cities with at least 500 fire incidents)
| Kingsland: | 5 minutes |
| St. Marys: | 5 minutes |
| Woodbine: | 7 minutes |
| Yulee: | 9 minutes |
| Fernandina Beach: | 6 minutes |
| Hilliard: | 12 minutes |
| Callahan: | 9 minutes |
| Folkston: | 9 minutes |
| Brunswick: | 5 minutes |
 According to the reports from the years 2002 - 2018 the average number of fire-related yearly casualties is 1. The highest number of reported injuries - 3 took place in 2016, and the lowest - 0 in 2002. The data has a constant trend.
The average number of injuries per 1,000 fire incidents is 6. This indicator was the highest - 30 in 2016, and the lowest 0 in 2002. The trend for casualties per 1,000 fires is dropping. Compared to the Georgia value the number of injuries per 1,000 fire incidents is lower.
According to the reports from the years 2002 - 2018 the average number of fire-related yearly casualties is 1. The highest number of reported injuries - 3 took place in 2016, and the lowest - 0 in 2002. The data has a constant trend.
The average number of injuries per 1,000 fire incidents is 6. This indicator was the highest - 30 in 2016, and the lowest 0 in 2002. The trend for casualties per 1,000 fires is dropping. Compared to the Georgia value the number of injuries per 1,000 fire incidents is lower.
 25.1% incidents where reported in the morning and 74.9% in the evening. The most fires (15.1%) took place on Monday, and the least (12.6%) on Wednesday.
 According to the 1,426 reports from years 2002 - 2018 most fires (11.4%) took place during March, and the least (5.3%) in August.
 Out of all 14,502 cases reported during the years 2002 - 2018, the most belonged to the categories: Rescue & EMS (61.0%), Good Intent Call (11.5%), and Fire (9.8%).
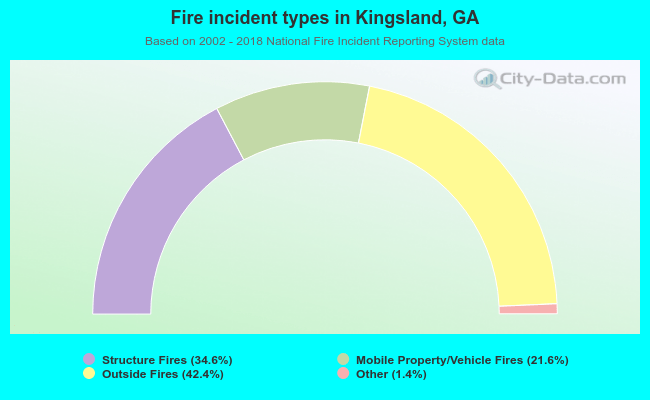 When looking into fire subcategories, the most reports belonged to: Outside Fires (42.4%), and Structure Fires (34.6%).