Kearney: Fire Incidents, Nebraska (NE)
Where are fire incidents reported in Kearney, NE
Something went wrong! Please refresh the page.
| Fire incidents reported | |
|---|---|
| Sreet name | Count |
| 2ND AVE | 144 |
| HWY 30 | 106 |
| I-80 | 94 |
| GRAND AVE | 84 |
| 25TH ST | 72 |
| CENTRAL AVE | 64 |
| 39TH ST | 62 |
| 24TH ST | 60 |
| AVE C | 50 |
| 23RD ST | 48 |
| 11TH ST | 46 |
| 56TH ST | 44 |
| 31ST ST | 42 |
| 15TH AVE | 40 |
| 3RD AVE | 40 |
| AVE F | 40 |
| I80 | 38 |
| 30TH AVE | 34 |
| 6TH AVE | 32 |
| 8TH ST | 32 |
| AVE I | 32 |
| 17TH AVE | 28 |
| AVE G | 28 |
| 26TH ST | 26 |
| 4TH AVE | 26 |
| 17TH ST | 24 |
| 18TH ST | 24 |
| 22ND ST | 24 |
| 62ND AVE | 24 |
| 78TH ST | 24 |
| Other | 134 |
2002 - 2017 National Fire Incident Reporting System (NFIRS) incidents
- Incident types reported to NFIRS in Kearney, NE
- 1,56651.4%Fire
- 52117.1%Hazardous Condition
- 37512.3%Rescue & EMS
- 2417.9%False Alarm
- 1314.3%Good Intent Call
- 1244.1%Special Incident
- 772.5%Service Call
- 60.2%Overpressure Rupture
- 50.2%Severe Weather
- Fire incident types reported to NFIRS in Kearney, NE
- 69344.3%Outside Fires
- 43627.8%Structure Fires
- 36723.4%Mobile Property/Vehicle Fires
- 704.5%Other
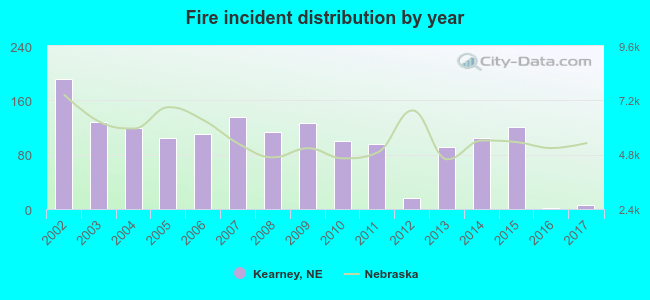 Based on the data from the years 2002 - 2017 the average number of fires per year is 98. The highest number of fire incidents - 192 took place in 2002, and the least - 2 in 2016. The data has a dropping trend.
The average number of yearly fire incidents per 10k residents in Kearney, NE compared to nearest cities:
(Note: Based on data for the last 3 years, including only cities with population 5,000 and above)
| Kearney: | 1.2 |
| Holdrege: | 37.5 |
| Lexington: | 11.5 |
| Hastings: | 42.5 |
| Grand Island: | 19.1 |
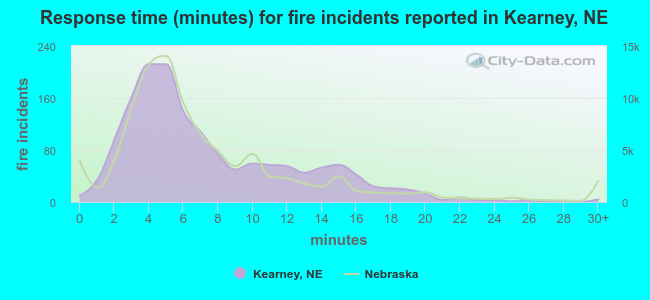 The median response time based on all reported fire incidents is 6 minutes. This is about the same as the Nebraska median value.
The median response time in Kearney, NE compared to nearest cities:
(Note: Based on data for all years, including only cities with at least 500 fire incidents)
| Kearney: | 6 minutes |
| Hastings: | 5 minutes |
| Grand Island: | 5 minutes |
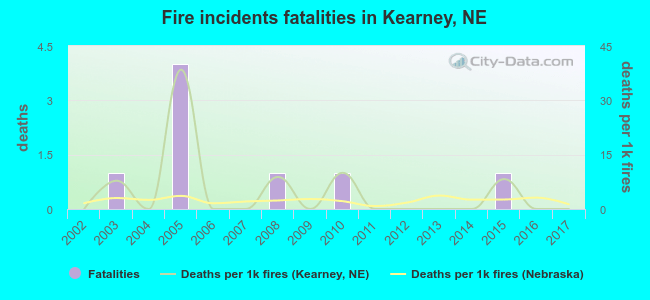 According to the data from the years 2002 - 2017 the average number of fire-related yearly deaths is 1. The highest number of reported deaths - 4 took place in 2005, and the lowest - 0 in 2002. The data has a constant trend.
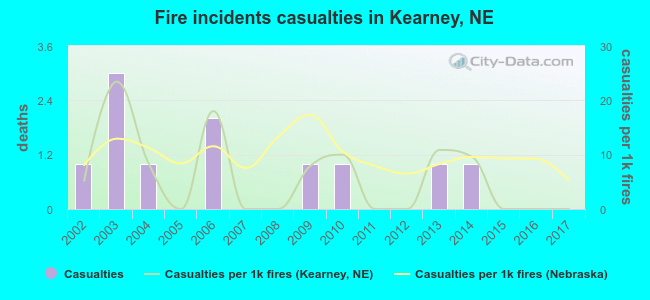 According to the reports from the years 2002 - 2017 the average number of fire-related yearly casualties is 1. The highest number of reported casualties - 3 took place in 2003, and the lowest - 0 in 2005. The data has a dropping trend.
The average number of casualties per 1,000 fires is 6. This indicator was the highest - 23 in 2003, and the lowest 0 in 2005. The trend for casualties per 1,000 incidents is declining. Compared to the Nebraska value the number of injuries per 1,000 incidents is lower.
According to the reports from the years 2002 - 2017 the average number of fire-related yearly casualties is 1. The highest number of reported casualties - 3 took place in 2003, and the lowest - 0 in 2005. The data has a dropping trend.
The average number of casualties per 1,000 fires is 6. This indicator was the highest - 23 in 2003, and the lowest 0 in 2005. The trend for casualties per 1,000 incidents is declining. Compared to the Nebraska value the number of injuries per 1,000 incidents is lower.Casualties per 1,000 incidents in Kearney, NE compared to nearest cities:
(Note: Based on data for all years, including only cities with at least 500 fire incidents)
| Kearney: | 7.0 |
| Hastings: | 16.5 |
| Grand Island: | 11.1 |
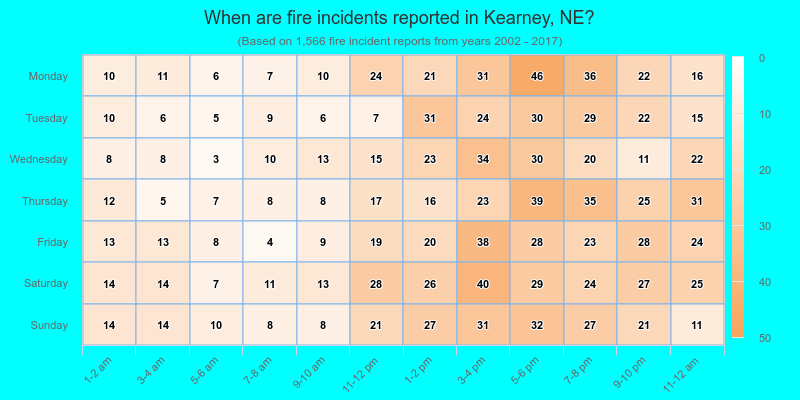
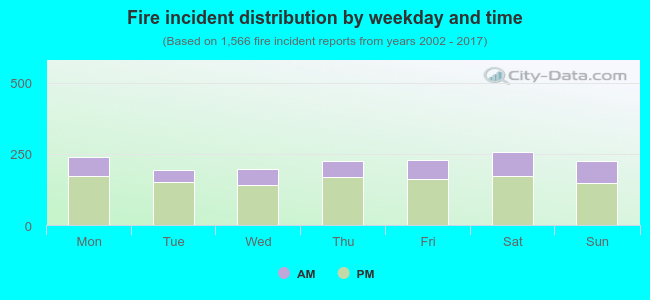 28.9% incidents where reported in the morning and 71.1% in the evening. The most fires (16.5%) took place on Saturday, and the least (12.4%) on Tuesday.
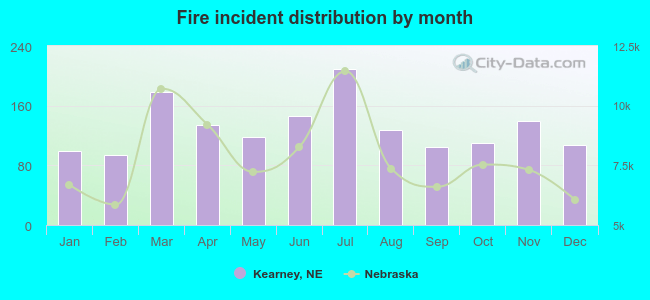 According to the 1,566 reports from years 2002 - 2017 most fires (13.3%) took place during July, and the least (6.0%) in February.
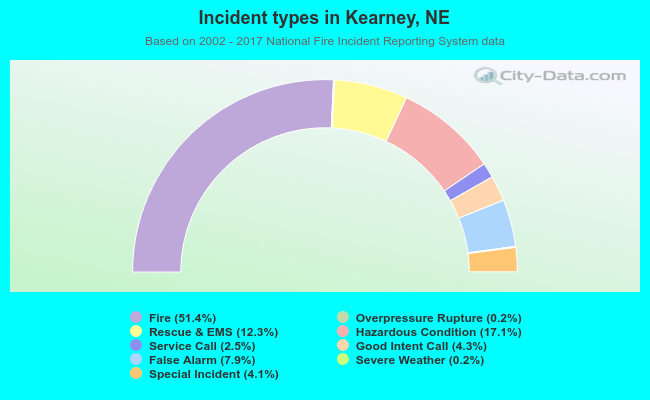 Out of all 3,046 cases reported during the years 2002 - 2017, the most belonged to the categories: Fire (51.4%), Hazardous Condition (17.1%), and Rescue & EMS (12.3%).
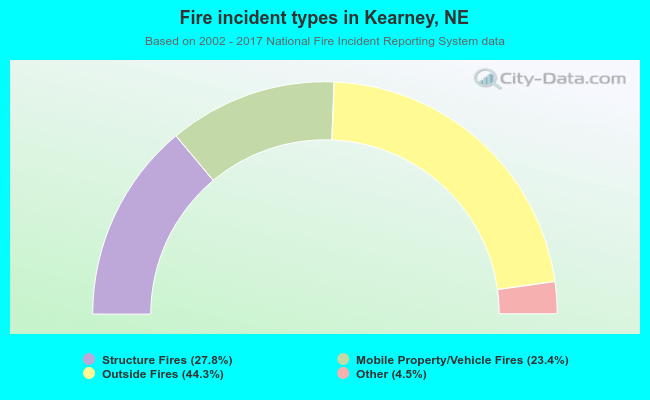 When looking into fire subcategories, the most incidents belonged to: Outside Fires (44.3%), and Structure Fires (27.8%).