Kalispell: Fire Incidents, Montana (MT)
Where are fire incidents reported in Kalispell, MT
Something went wrong! Please refresh the page.
| Fire incidents reported | |
|---|---|
| Sreet name | Count |
| 1ST AVE | 128 |
| 5TH AVE | 102 |
| 3RD AVE | 80 |
| MAIN ST | 78 |
| 93 HWY | 76 |
| 2ND AVE | 72 |
| 4TH AVE | 68 |
| HWY 2 | 66 |
| MERIDIAN RD | 66 |
| WHITEFISH STAGE RD | 58 |
| HIGHWAY 93 | 52 |
| IDAHO ST | 50 |
| 7TH AVE | 48 |
| AIRPORT RD | 46 |
| 6TH AVE | 40 |
| FARMTOMARKET RD | 40 |
| HWY 35 | 40 |
| LIBERTY ST | 40 |
| HIGHWAY 2 | 38 |
| 2 HWY | 34 |
| 8TH AVE | 34 |
| FOOTHILL RD | 34 |
| IDAHO | 30 |
| RHODES DR | 30 |
| WEST VALLEY DR | 30 |
| 2ND ST | 28 |
| LOWER VALLEY RD | 28 |
| CONRAD DR | 26 |
| HWY 93 | 26 |
| LOST CREEK DR | 26 |
| Other | 1,533 |
2002 - 2018 National Fire Incident Reporting System (NFIRS) incidents
- Incident types reported to NFIRS in Kalispell, MT
- 19,06863.3%Rescue & EMS
- 3,24110.8%Good Intent Call
- 3,04710.1%Fire
- 2,3377.8%Hazardous Condition
- 1,4184.7%False Alarm
- 8762.9%Service Call
- 780.3%Special Incident
- Fire incident types reported to NFIRS in Kalispell, MT
- 1,40746.2%Structure Fires
- 1,17638.6%Outside Fires
- 34411.3%Mobile Property/Vehicle Fires
- 1203.9%Other
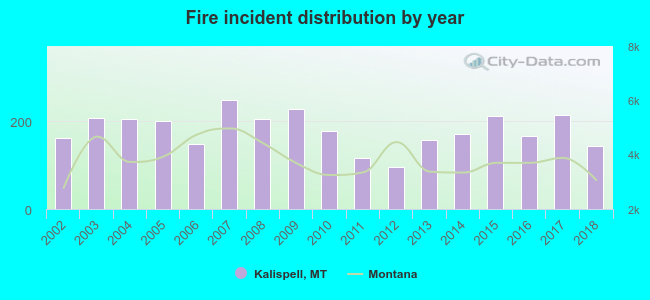 According to the data from the years 2002 - 2018 the average number of fires per year is 179. The highest number of fires - 247 took place in 2007, and the least - 96 in 2012. The data has a declining trend.
 The median response time based on all reported fire incidents is 8 minutes. This is similar to the Montana median value.
The median response time in Kalispell, MT compared to nearest cities:
(Note: Based on data for all years, including only cities with at least 500 fire incidents)
| Kalispell: | 8 minutes |
| Columbia Falls: | 11 minutes |
| Polson: | 8 minutes |
| Libby: | 7 minutes |
 Based on the data from the years 2002 - 2018 the average number of fire-related yearly deaths is 0. The highest number of reported deaths - 3 took place in 2016, and the lowest - 0 in 2002. The data has an increasing trend.
The average number of fatalities per 1,000 fire incidents is 3. This indicator was the highest - 18 in 2016, and the lowest 0 in 2002. The trend for fatalities per 1,000 fire incidents is rising. Compared to the state value the number of fatalities per 1,000 fires is similar.
Based on the data from the years 2002 - 2018 the average number of fire-related yearly deaths is 0. The highest number of reported deaths - 3 took place in 2016, and the lowest - 0 in 2002. The data has an increasing trend.
The average number of fatalities per 1,000 fire incidents is 3. This indicator was the highest - 18 in 2016, and the lowest 0 in 2002. The trend for fatalities per 1,000 fire incidents is rising. Compared to the state value the number of fatalities per 1,000 fires is similar.Deaths per 1,000 incidents in Kalispell, MT compared to nearest cities:
(Note: Based on data for all years, including only cities with at least 2,500 fire incidents)
| Kalispell: | 2.3 |
 According to the reports from the years 2002 - 2018 the average number of fire-related casualties per year is 1. The highest number of reported injuries - 5 took place in 2004, and the lowest - 0 in 2006. The data has a decreasing trend.
The average number of casualties per 1,000 fire incidents is 4. This indicator was the highest - 25 in 2002, and the lowest 0 in 2006. The trend for casualties per 1,000 incidents is dropping. Compared to the Montana value the number of casualties per 1,000 fires is lower.
According to the reports from the years 2002 - 2018 the average number of fire-related casualties per year is 1. The highest number of reported injuries - 5 took place in 2004, and the lowest - 0 in 2006. The data has a decreasing trend.
The average number of casualties per 1,000 fire incidents is 4. This indicator was the highest - 25 in 2002, and the lowest 0 in 2006. The trend for casualties per 1,000 incidents is dropping. Compared to the Montana value the number of casualties per 1,000 fires is lower.Casualties per 1,000 incidents in Kalispell, MT compared to nearest cities:
(Note: Based on data for all years, including only cities with at least 500 fire incidents)
| Kalispell: | 3.9 |
| Columbia Falls: | 1.5 |
| Polson: | 8.2 |
| Libby: | 2.4 |
 31.6% incidents where reported in the morning and 68.4% in the evening. The most fires (16.0%) took place on Saturday, and the least (12.9%) on Thursday.
 According to the 3,047 incident reports from years 2002 - 2018 most fires (12.3%) took place during April, and the least (6.3%) in December.
 Out of all 30,109 cases reported during the years 2002 - 2018, the most belonged to the categories: Rescue & EMS (63.3%), Good Intent Call (10.8%), and Fire (10.1%).
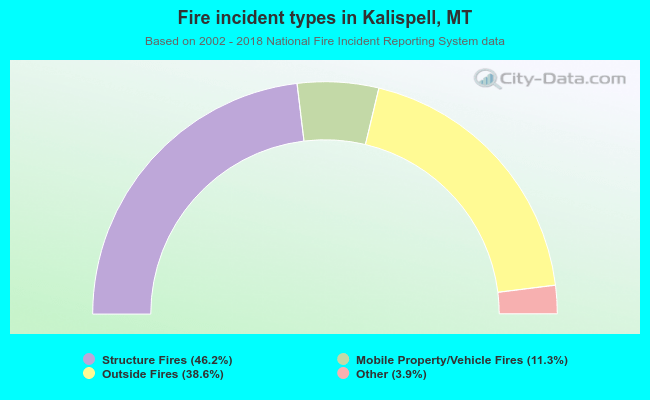 When looking into fire subcategories, the most incidents belonged to: Structure Fires (46.2%), and Outside Fires (38.6%).