Isla Vista: Fire Incidents, California (CA)
Where are fire incidents reported in Isla Vista, CA
Something went wrong! Please refresh the page.
|
| |||||||||||||||||||||||||||||||||||||||||||||||||||||||||||||||||||||||||||||||||||||||||||||||||||||||||||||
2005 - 2018 National Fire Incident Reporting System (NFIRS) incidents
- Incident types reported to NFIRS in Isla Vista, CA
- 2,95063.2%Rescue & EMS
- 60513.0%Good Intent Call
- 54411.6%Fire
- 2014.3%Hazardous Condition
- 1914.1%False Alarm
- 1683.6%Service Call
- 60.1%Overpressure Rupture
- 50.1%Special Incident
- Fire incident types reported to NFIRS in Isla Vista, CA
- 43680.1%Outside Fires
- 7914.5%Structure Fires
- 193.5%Other
- 101.8%Mobile Property/Vehicle Fires
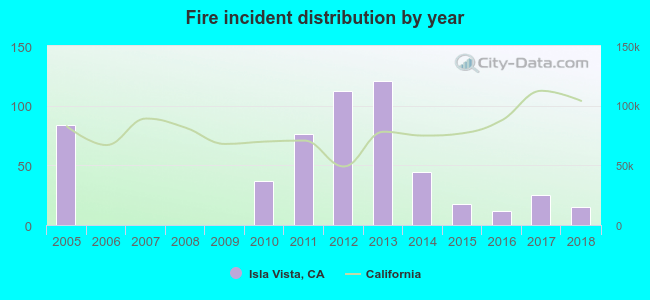 Based on the data from the years 2005 - 2018 the average number of fire incidents per year is 39. The highest number of fires - 121 took place in 2013, and the least - 0 in 2006. The data has a declining trend.
The average number of yearly fire incidents per 10k residents in Isla Vista, CA compared to nearest cities:
(Note: Based on data for the last 3 years, including only cities with population 5,000 and above)
| Isla Vista: | 7.5 |
| Goleta: | 26.2 |
| Santa Barbara: | 23.4 |
| Montecito: | 4.1 |
| Carpinteria: | 21.2 |
| Solvang: | 27.8 |
| Buellton: | 52.2 |
| Mira Monte: | 4.4 |
| Ojai: | 47.6 |
 The median response time based on all reported fire incidents is 6 minutes. This is close to the state median value.
The median response time in Isla Vista, CA compared to nearest cities:
(Note: Based on data for all years, including only cities with at least 500 fire incidents)
| Isla Vista: | 6 minutes |
| Goleta: | 7 minutes |
| Santa Barbara: | 5 minutes |
| Ventura: | 7 minutes |
| Lompoc: | 5 minutes |
| Mission Hills: | 5 minutes |
| Oxnard: | 5 minutes |
| Port Hueneme: | 6 minutes |
| Santa Paula: | 6 minutes |
 58.5% incidents where reported in the morning and 41.5% in the evening. The most fires (25.6%) took place on Saturday, and the least (7.2%) on Wednesday.
 Based on the 544 fire incidents from years 2005 - 2018 most fires (23.5%) took place during June, and the least (4.8%) in July.
 Out of all 4,671 cases reported during the years 2005 - 2018, the most belonged to the categories: Rescue & EMS (63.2%), Good Intent Call (13.0%), and Fire (11.6%).
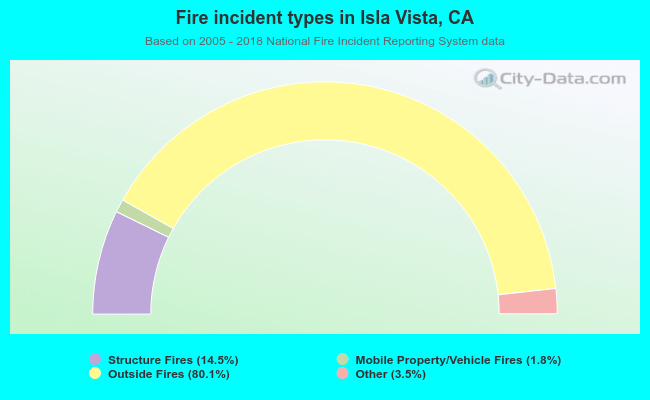 When looking into fire subcategories, the most incidents belonged to: Outside Fires (80.1%), and Structure Fires (14.5%).