Idaho Falls: Fire Incidents, Idaho (ID)
Where are fire incidents reported in Idaho Falls, ID
Something went wrong! Please refresh the page.
| Fire incidents reported | |
|---|---|
| Sreet name | Count |
| YELLOWSTONE HWY | 266 |
| SUNNYSIDE RD | 150 |
| BROADWAY ST | 144 |
| LINCOLN RD | 142 |
| HOLMES AVE | 116 |
| IONA RD | 114 |
| WOODRUFF AVE | 98 |
| 17TH ST | 88 |
| 1 ST | 72 |
| 17 ST | 72 |
| SKYLINE DR | 66 |
| AMMON RD | 64 |
| US HWY 20 HWY | 62 |
| RIRIE HWY | 60 |
| ARCO HWY | 56 |
| 25TH EAST RD | 50 |
| 5TH WEST RD | 50 |
| BOULEVARD ST | 50 |
| 1ST ST | 46 |
| FOOTHILL RD | 46 |
| 145 NORTH RD | 44 |
| 45TH EAST RD | 44 |
| 15TH EAST RD | 40 |
| GARFIELD ST | 38 |
| ELVA ST | 36 |
| LINDSAY BLVD | 36 |
| 49TH SOUTH RD | 34 |
| 5 EN LEWISVILLE HWY RD | 34 |
| ANDERSON ST | 34 |
| PANCHERI DR | 34 |
| Other | 1,966 |
2002 - 2018 National Fire Incident Reporting System (NFIRS) incidents
- Incident types reported to NFIRS in Idaho Falls, ID
- 14,52556.7%Rescue & EMS
- 4,15216.2%Fire
- 2,59210.1%Hazardous Condition
- 2,3089.0%Good Intent Call
- 1,6126.3%False Alarm
- 3301.3%Service Call
- 420.2%Overpressure Rupture
- 340.1%Special Incident
- Fire incident types reported to NFIRS in Idaho Falls, ID
- 2,32456.0%Outside Fires
- 95122.9%Structure Fires
- 60014.5%Mobile Property/Vehicle Fires
- 2776.7%Other
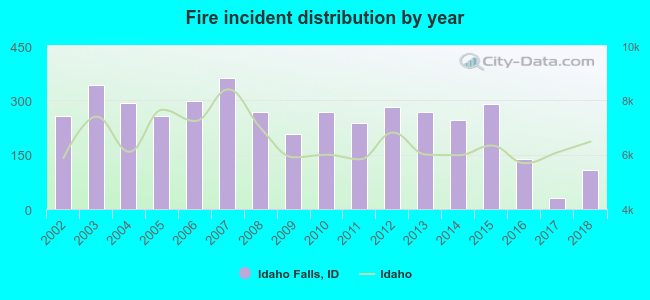 According to the data from the years 2002 - 2018 the average number of fires per year is 244. The highest number of reported fire incidents - 362 took place in 2007, and the least - 31 in 2017. The data has a decreasing trend.
 The median response time based on all reported fire incidents is 7 minutes. This is close to the Idaho median value.
 According to the reports from the years 2002 - 2018 the average number of fire-related fatalities per year is 1. The highest number of reported deaths - 6 took place in 2010, and the lowest - 0 in 2004. The data has a declining trend.
The average number of fatalities per 1,000 fires is 4. This indicator was the highest - 22 in 2010, and the lowest 0 in 2004. The trend for deaths per 1,000 incidents is declining. Compared to the Idaho value the number of deaths per 1,000 incidents is higher.
According to the reports from the years 2002 - 2018 the average number of fire-related fatalities per year is 1. The highest number of reported deaths - 6 took place in 2010, and the lowest - 0 in 2004. The data has a declining trend.
The average number of fatalities per 1,000 fires is 4. This indicator was the highest - 22 in 2010, and the lowest 0 in 2004. The trend for deaths per 1,000 incidents is declining. Compared to the Idaho value the number of deaths per 1,000 incidents is higher.Deaths per 1,000 incidents in Idaho Falls, ID compared to nearest cities:
(Note: Based on data for all years, including only cities with at least 2,500 fire incidents)
| Idaho Falls: | 4.1 |
| Blackfoot: | 1.1 |
 According to the data from the years 2002 - 2018 the average number of fire-related casualties per year is 3. The highest number of reported casualties - 10 took place in 2013, and the lowest - 0 in 2016. The data has a decreasing trend.
The average number of casualties per 1,000 fire incidents is 9. This indicator was the highest - 37 in 2013, and the lowest 0 in 2016. The trend for casualties per 1,000 incidents is declining. Compared to the Idaho value the number of injuries per 1,000 fires is higher.
According to the data from the years 2002 - 2018 the average number of fire-related casualties per year is 3. The highest number of reported casualties - 10 took place in 2013, and the lowest - 0 in 2016. The data has a decreasing trend.
The average number of casualties per 1,000 fire incidents is 9. This indicator was the highest - 37 in 2013, and the lowest 0 in 2016. The trend for casualties per 1,000 incidents is declining. Compared to the Idaho value the number of injuries per 1,000 fires is higher.
 27.3% incidents where reported in the morning and 72.7% in the evening. The most fires (17.2%) took place on Saturday, and the least (12.3%) on Sunday.
 According to the 4,152 fire incident reports from years 2002 - 2018 most fires (16.4%) took place during July, and the least (4.3%) in February.
 Out of all 25,601 cases reported during the years 2002 - 2018, the most belonged to the categories: Rescue & EMS (56.7%), Fire (16.2%), and Hazardous Condition (10.1%).
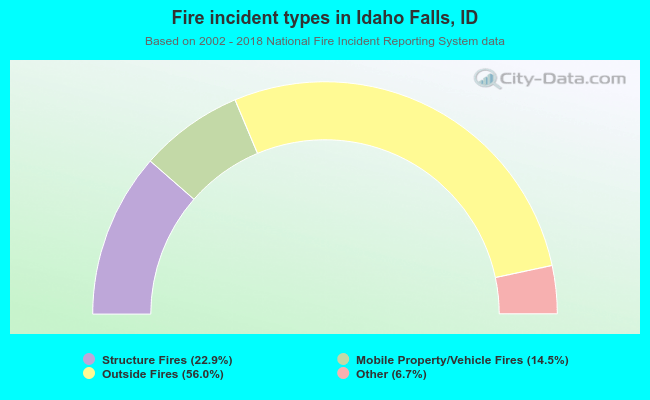 When looking into fire subcategories, the most incidents belonged to: Outside Fires (56.0%), and Structure Fires (22.9%).