Hartford: Fire Incidents, Vermont (VT)
Where are fire incidents reported in Hartford, VT
Something went wrong! Please refresh the page.
|
| |||||||||||||||||||||||||||||||||||||||||||||||||||||||||||||||||||||||||||||||||||||||||||||||||||||||||||||
2004 - 2018 National Fire Incident Reporting System (NFIRS) incidents
- Incident types reported to NFIRS in Hartford, VT
- 2,99768.2%Rescue & EMS
- 4309.8%Service Call
- 3167.2%False Alarm
- 2255.1%Fire
- 2054.7%Hazardous Condition
- 2004.5%Good Intent Call
- 130.3%Special Incident
- 70.2%Severe Weather
- Fire incident types reported to NFIRS in Hartford, VT
- 12153.8%Structure Fires
- 5424.0%Outside Fires
- 3013.3%Mobile Property/Vehicle Fires
- 208.9%Other
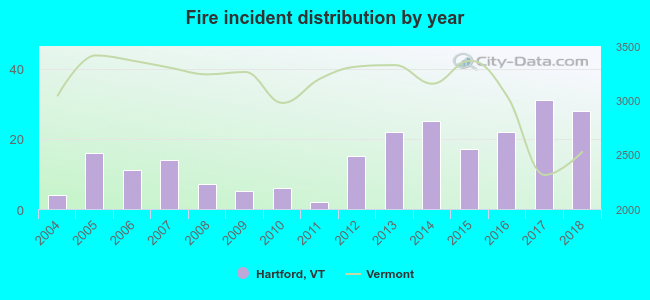 According to the data from the years 2004 - 2018 the average number of fire incidents per year is 15. The highest number of fire incidents - 31 took place in 2017, and the least - 2 in 2011. The data has an increasing trend.
The average number of yearly fire incidents per 10k residents in Hartford, VT compared to nearest cities:
(Note: Based on data for the last 3 years, including only cities with population 5,000 and above)
| Hartford: | 27.1 |
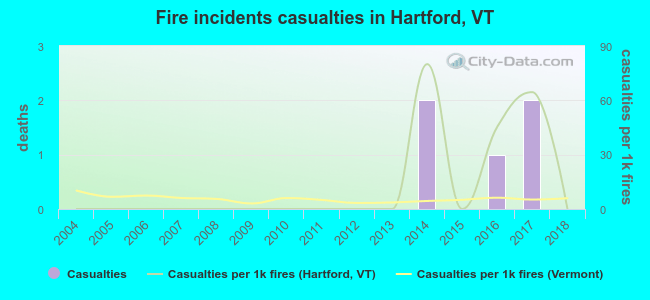 Based on the reports from the years 2004 - 2018 the average number of fire-related yearly casualties is 0. The highest number of casualties - 2 took place in 2014, and the lowest - 0 in 2004. The data has a constant trend.
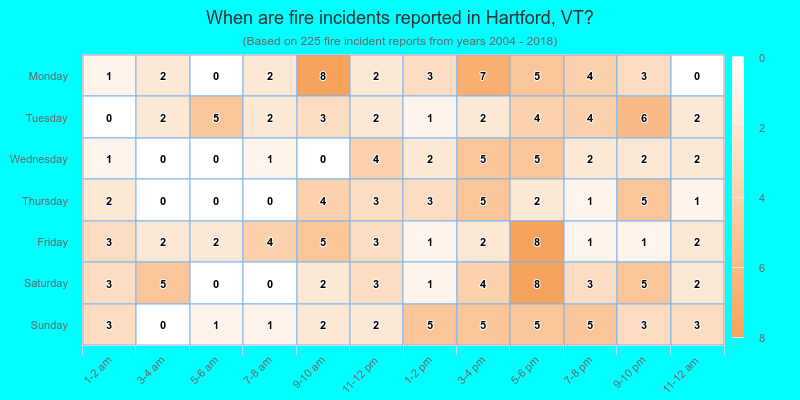
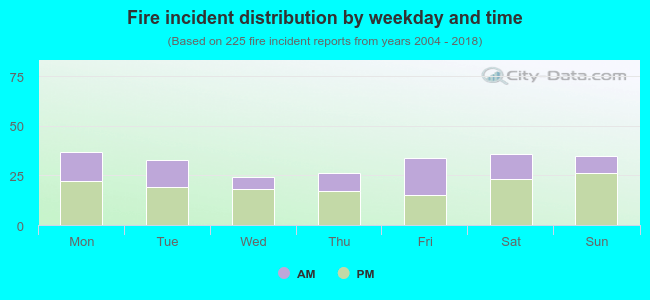 37.8% incidents where reported in the morning and 62.2% in the evening. The most fires (16.4%) took place on Monday, and the least (10.7%) on Wednesday.
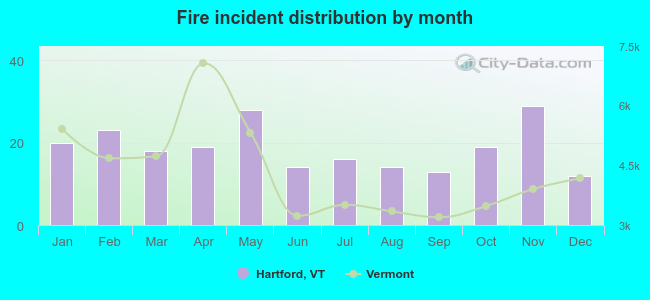 Based on the 225 fires from years 2004 - 2018 most fires (12.9%) took place during November, and the least (5.3%) in December.
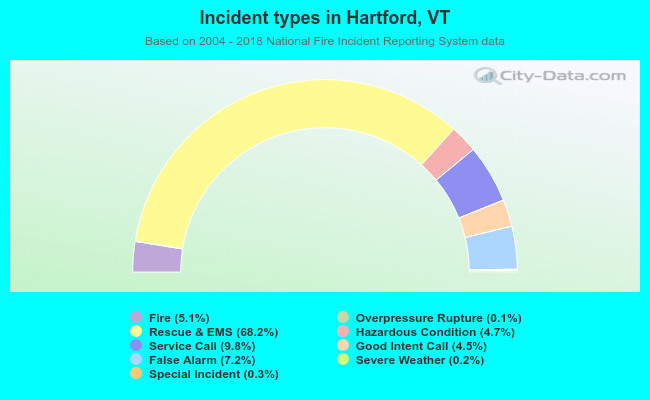 Out of all 4,396 cases reported during the years 2004 - 2018, the most belonged to the categories: Rescue & EMS (68.2%), Service Call (9.8%), and False Alarm (7.2%).
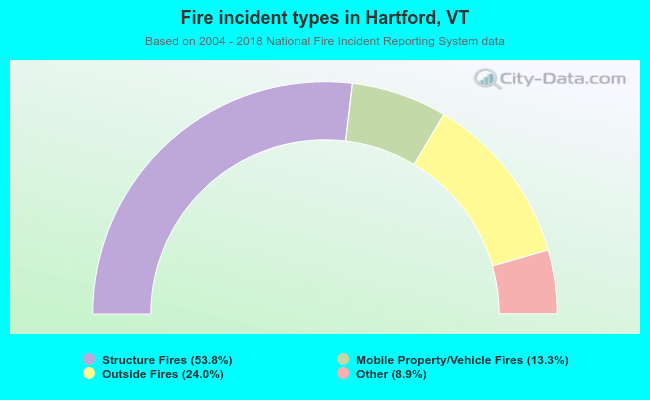 When looking into fire subcategories, the most incidents belonged to: Structure Fires (53.8%), and Outside Fires (24.0%).