Griswold: Fire Incidents, Connecticut (CT)
Where are fire incidents reported in Griswold, CT
Something went wrong! Please refresh the page.
| Fire incidents reported | |
|---|---|
| Sreet name | Count |
| MAIN ST | 134 |
| ASHLAND ST | 98 |
| TAYLOR HILL RD | 88 |
| VOLUNTOWN RD | 86 |
| GLASGO RD | 68 |
| HOPEVILLE RD | 46 |
| EDMOND RD | 34 |
| BETHEL RD | 30 |
| SHETUCKET TPKE | 30 |
| PLAINFIELD RD | 28 |
| ROODE RD | 22 |
| RIXTOWN RD | 20 |
| SLATER AVE | 20 |
| LATHAM DR | 18 |
| MATHEWSON ST | 18 |
| NORMAN RD | 18 |
| BROWN AVE | 16 |
| FOGARTY AVE | 16 |
| LEHA AVE | 16 |
| PRESTON RD | 16 |
| BREWSTER RD | 14 |
| LESTER RD | 14 |
| MECHANIC ST | 14 |
| HILL ST | 12 |
| OAKVILLE RD | 12 |
| PACHAUG RIVER DR | 12 |
| RICHARDSON HILL RD | 12 |
| WEDGEWOOD DR | 12 |
| BERGENDAHL DR | 10 |
| GEER RD | 10 |
2002 - 2018 National Fire Incident Reporting System (NFIRS) incidents
- Incident types reported to NFIRS in Griswold, CT
- 2,88954.5%Rescue & EMS
- 90117.0%Fire
- 5149.7%Hazardous Condition
- 3987.5%Service Call
- 3737.0%False Alarm
- 2184.1%Good Intent Call
- Fire incident types reported to NFIRS in Griswold, CT
- 51557.2%Structure Fires
- 22625.1%Outside Fires
- 10711.9%Mobile Property/Vehicle Fires
- 535.9%Other
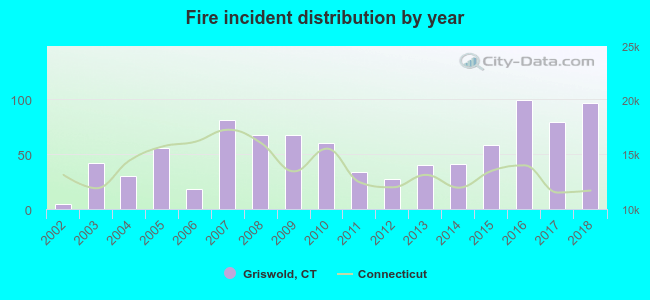 According to the data from the years 2002 - 2018 the average number of fire incidents per year is 53. The highest number of reported fire incidents - 99 took place in 2016, and the least - 5 in 2002. The data has an increasing trend.
The average number of yearly fire incidents per 10k residents in Griswold, CT compared to nearest cities:
(Note: Based on data for the last 3 years, including only cities with population 5,000 and above)
| Griswold: | 76.7 |
| Plainfield: | 14.5 |
| Canterbury: | 63.7 |
| Norwich: | 38.9 |
| North Stonington: | 49.1 |
| Ledyard: | 22.6 |
| Brooklyn: | 54.4 |
| Montville: | 19.2 |
| Windham: | 5.9 |
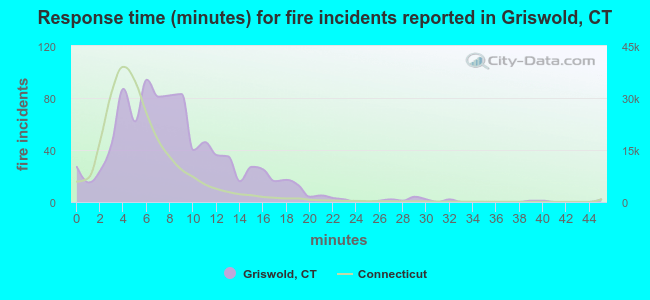 The median response time based on all reported fire incidents is 8 minutes. This is higher than the Connecticut median value.
The median response time in Griswold, CT compared to nearest cities:
(Note: Based on data for all years, including only cities with at least 500 fire incidents)
| Griswold: | 8 minutes |
| Preston: | 8 minutes |
| Plainfield: | 8 minutes |
| Norwich: | 4 minutes |
| Moosup: | 8 minutes |
| North Stonington: | 10 minutes |
| Ledyard: | 9 minutes |
| Brooklyn: | 8 minutes |
| Montville: | 7 minutes |
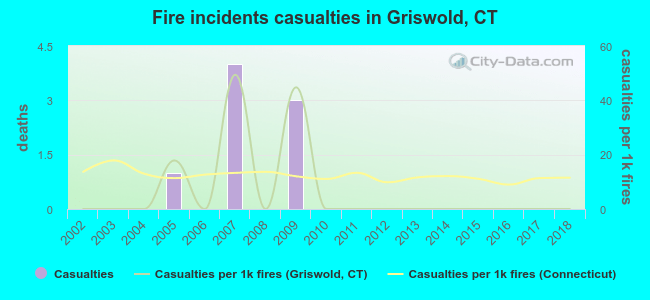 Based on the data from the years 2002 - 2018 the average number of fire-related yearly casualties is 0. The highest number of reported casualties - 4 took place in 2007, and the lowest - 0 in 2002. The data has a constant trend.
The average number of casualties per 1,000 fires is 7. This indicator was the highest - 49 in 2007, and the lowest 0 in 2002. The trend for casualties per 1,000 fire incidents is constant. Compared to the state value the number of injuries per 1,000 incidents is lower.
Based on the data from the years 2002 - 2018 the average number of fire-related yearly casualties is 0. The highest number of reported casualties - 4 took place in 2007, and the lowest - 0 in 2002. The data has a constant trend.
The average number of casualties per 1,000 fires is 7. This indicator was the highest - 49 in 2007, and the lowest 0 in 2002. The trend for casualties per 1,000 fire incidents is constant. Compared to the state value the number of injuries per 1,000 incidents is lower.Casualties per 1,000 incidents in Griswold, CT compared to nearest cities:
(Note: Based on data for all years, including only cities with at least 500 fire incidents)
| Griswold: | 8.9 |
| Preston: | 0.0 |
| Plainfield: | 2.8 |
| Norwich: | 7.6 |
| Moosup: | 5.6 |
| North Stonington: | 0.0 |
| Ledyard: | 14.5 |
| Brooklyn: | 5.0 |
| Montville: | 4.5 |
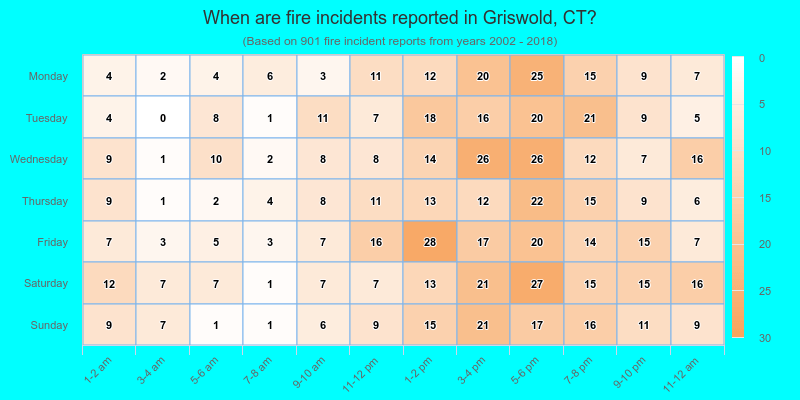
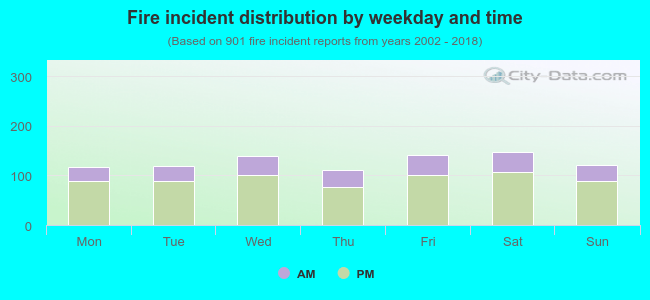 27.6% incidents where reported in the morning and 72.4% in the evening. The most fires (16.4%) took place on Saturday, and the least (12.4%) on Thursday.
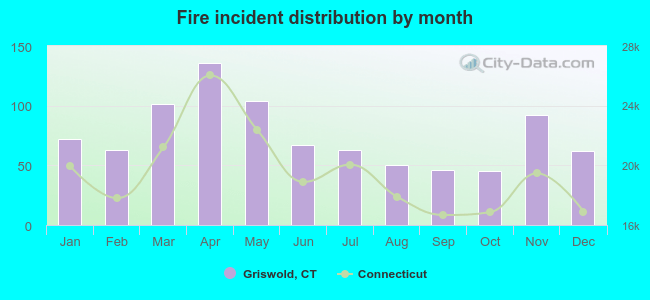 Based on the 901 incident reports from years 2002 - 2018 most fires (15.1%) took place during April, and the least (5.0%) in October.
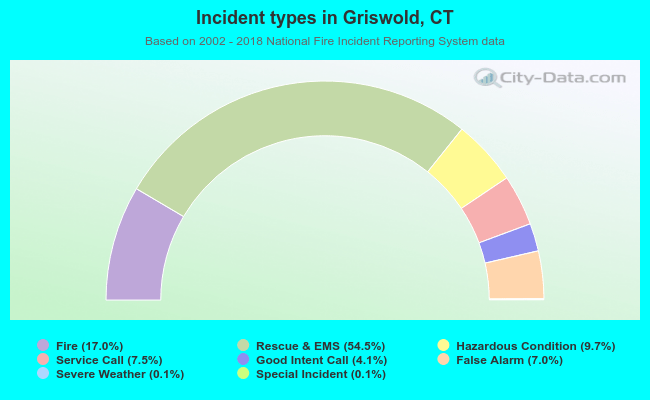 Out of all 5,301 cases reported during the years 2002 - 2018, the most belonged to the categories: Overpressure Rupture (54.5%), Fire (17.0%), and Rescue & EMS (9.7%).
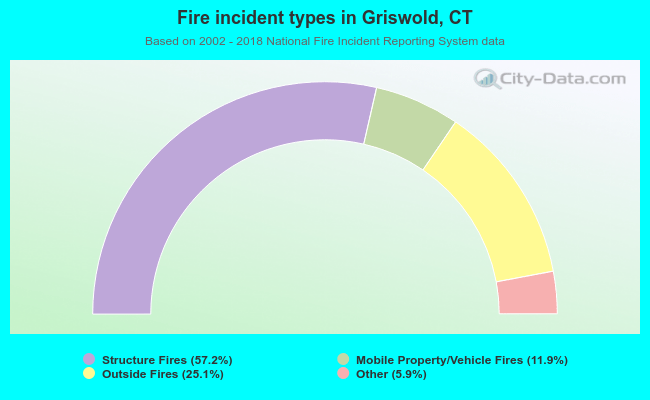 When looking into fire subcategories, the most incidents belonged to: Structure Fires (57.2%), and Outside Fires (25.1%).