Greenville: Fire Incidents, North Carolina (NC)
Where are fire incidents reported in Greenville, NC
Something went wrong! Please refresh the page.
| Fire incidents reported | |
|---|---|
| Sreet name | Count |
| MEMORIAL DR | 334 |
| GREENVILLE BLVD | 262 |
| 10TH ST | 216 |
| STANTONSBURG RD | 174 |
| GREENVILLE | 122 |
| 5TH ST | 116 |
| CHARLES BLVD | 114 |
| OLD RIVER RD | 104 |
| ALLEN RD | 90 |
| MARTIN LUTHER KING JR HWY | 88 |
| OLD CREEK RD | 88 |
| EVANS ST | 86 |
| 14TH ST | 82 |
| 3RD ST | 78 |
| ARLINGTON BLVD | 72 |
| US 264 | 68 |
| FIRE TOWER RD | 62 |
| DICKINSON AVE | 60 |
| ARLINGTON | 58 |
| GREENE ST | 58 |
| CONCORD DR | 54 |
| HOOKER RD | 52 |
| RED BANKS RD | 50 |
| RIVER BLUFF RD | 50 |
| FROG LEVEL RD | 48 |
| PACTOLUS HWY | 48 |
| MACGREGOR DOWNS RD | 46 |
| SPRING FOREST RD | 46 |
| US 264 HWY | 46 |
| 4TH ST | 44 |
| Other | 3,314 |
2002 - 2018 National Fire Incident Reporting System (NFIRS) incidents
- Incident types reported to NFIRS in Greenville, NC
- 59,37972.6%Rescue & EMS
- 6,1307.5%Fire
- 5,9187.2%False Alarm
- 4,1265.0%Good Intent Call
- 3,1453.8%Hazardous Condition
- 2,8693.5%Service Call
- 940.1%Overpressure Rupture
- Fire incident types reported to NFIRS in Greenville, NC
- 2,68343.8%Structure Fires
- 2,14635.0%Outside Fires
- 1,01816.6%Mobile Property/Vehicle Fires
- 2834.6%Other
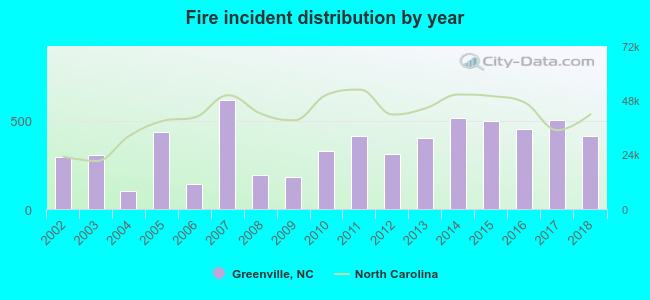 Based on the data from the years 2002 - 2018 the average number of fires per year is 361. The highest number of reported fires - 617 took place in 2007, and the least - 101 in 2004. The data has a rising trend.
The average number of yearly fire incidents per 10k residents in Greenville, NC compared to nearest cities:
(Note: Based on data for the last 3 years, including only cities with population 5,000 and above)
| Greenville: | 51.0 |
| Winterville: | 89.7 |
| Ayden: | 102.1 |
| Washington: | 112.4 |
| Tarboro: | 72.2 |
| Williamston: | 114.0 |
| Kinston: | 81.3 |
| Wilson: | 51.0 |
| Rocky Mount: | 52.5 |
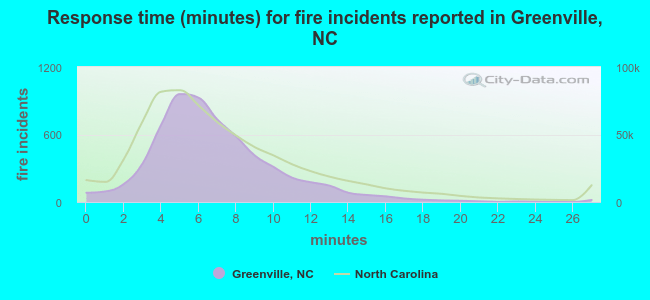 The median response time based on all reported fire incidents is 6 minutes. This is close to the state median value.
The median response time in Greenville, NC compared to nearest cities:
(Note: Based on data for all years, including only cities with at least 500 fire incidents)
| Greenville: | 6 minutes |
| Winterville: | 7 minutes |
| Ayden: | 5 minutes |
| Farmville: | 7 minutes |
| Grifton: | 8 minutes |
| Chocowinity: | 9 minutes |
| Washington: | 7 minutes |
| Snow Hill: | 8 minutes |
| Tarboro: | 5 minutes |
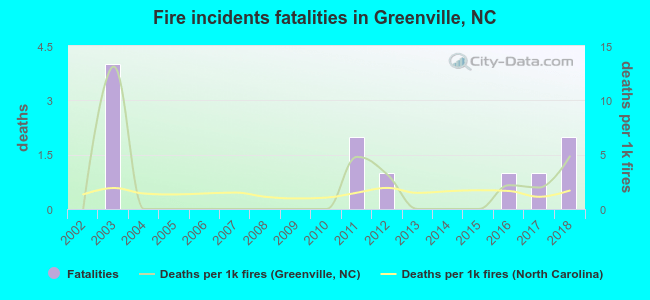 Based on the reports from the years 2002 - 2018 the average number of fire-related yearly deaths is 1. The highest number of deaths - 4 took place in 2003, and the lowest - 0 in 2002. The data has an increasing trend.
The average number of fatalities per 1,000 fire incidents is 2. This indicator was the highest - 13 in 2003, and the lowest 0 in 2002. The trend for fatalities per 1,000 incidents is rising. Compared to the state value the number of deaths per 1,000 fires is higher.
Based on the reports from the years 2002 - 2018 the average number of fire-related yearly deaths is 1. The highest number of deaths - 4 took place in 2003, and the lowest - 0 in 2002. The data has an increasing trend.
The average number of fatalities per 1,000 fire incidents is 2. This indicator was the highest - 13 in 2003, and the lowest 0 in 2002. The trend for fatalities per 1,000 incidents is rising. Compared to the state value the number of deaths per 1,000 fires is higher.Deaths per 1,000 incidents in Greenville, NC compared to nearest cities:
(Note: Based on data for all years, including only cities with at least 2,500 fire incidents)
| Greenville: | 1.8 |
| Kinston: | 1.6 |
| Wilson: | 1.9 |
| Rocky Mount: | 1.7 |
| Goldsboro: | 2.0 |
| New Bern: | 1.7 |
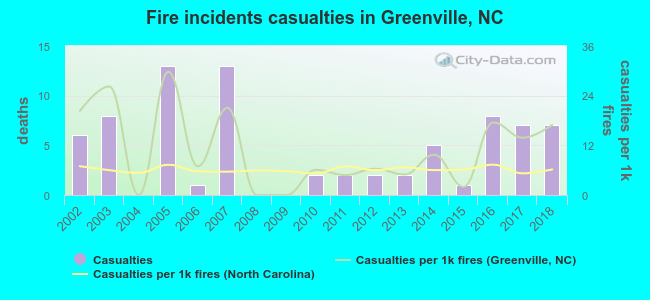 Based on the reports from the years 2002 - 2018 the average number of fire-related casualties per year is 5. The highest number of reported injuries - 13 took place in 2005, and the lowest - 0 in 2004. The data has an increasing trend.
The average number of casualties per 1,000 fires is 11. This indicator was the highest - 30 in 2005, and the lowest 0 in 2004. The trend for casualties per 1,000 fire incidents is decreasing. Compared to the state value the number of casualties per 1,000 fires is much higher.
Based on the reports from the years 2002 - 2018 the average number of fire-related casualties per year is 5. The highest number of reported injuries - 13 took place in 2005, and the lowest - 0 in 2004. The data has an increasing trend.
The average number of casualties per 1,000 fires is 11. This indicator was the highest - 30 in 2005, and the lowest 0 in 2004. The trend for casualties per 1,000 fire incidents is decreasing. Compared to the state value the number of casualties per 1,000 fires is much higher.Casualties per 1,000 incidents in Greenville, NC compared to nearest cities:
(Note: Based on data for all years, including only cities with at least 500 fire incidents)
| Greenville: | 12.6 |
| Winterville: | 6.6 |
| Ayden: | 1.7 |
| Farmville: | 0.0 |
| Grifton: | 4.6 |
| Chocowinity: | 3.1 |
| Washington: | 5.3 |
| Snow Hill: | 0.0 |
| Tarboro: | 3.2 |
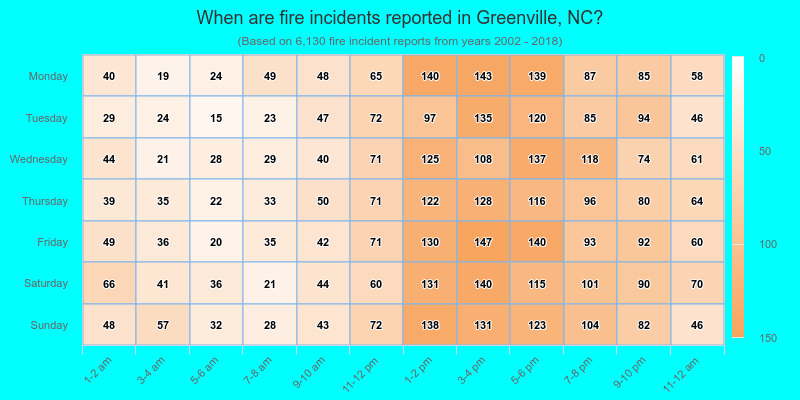
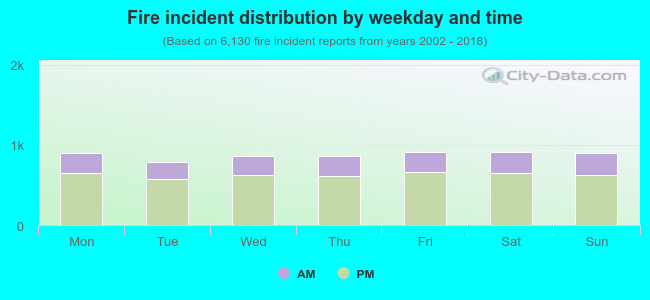 28.4% incidents where reported in the morning and 71.6% in the evening. The most fires (14.9%) took place on Friday, and the least (12.8%) on Tuesday.
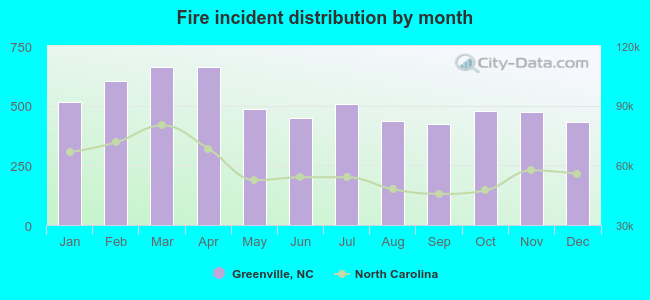 According to the 6,130 fire incident reports from years 2002 - 2018 most fires (10.8%) took place during April, and the least (6.9%) in September.
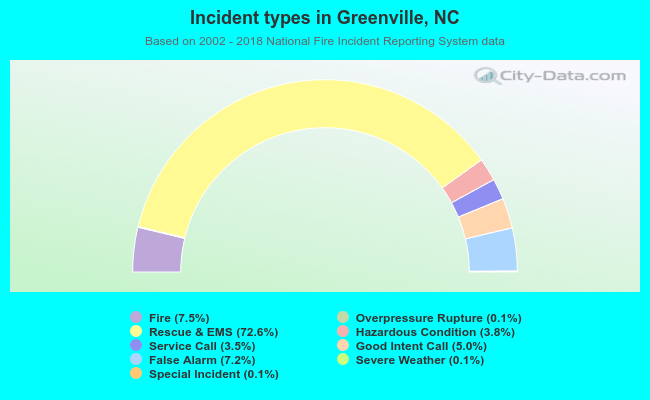 Out of all 81,756 cases reported during the years 2002 - 2018, the most belonged to the categories: Rescue & EMS (72.6%), Fire (7.5%), and False Alarm (7.2%).
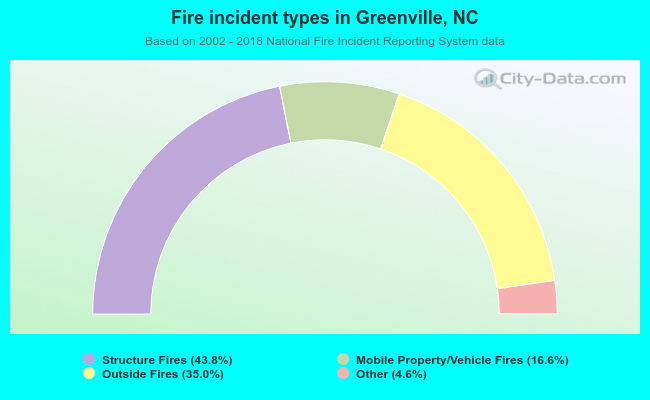 When looking into fire subcategories, the most reports belonged to: Structure Fires (43.8%), and Outside Fires (35.0%).