Greenacres: Fire Incidents, Florida (FL)
Where are fire incidents reported in Greenacres, FL
Something went wrong! Please refresh the page.
| Fire incidents reported | |
|---|---|
| Sreet name | Count |
| JOG RD | 190 |
| FOREST HILL | 140 |
| LAKE WORTH RD | 124 |
| 10TH | 80 |
| PINEHURST DR | 58 |
| HAVERHILL RD | 44 |
| ISLAND SHORES DR | 42 |
| MELALEUCA LN | 32 |
| JACKSON | 30 |
| FLEMING | 28 |
| PARKWAY CT | 28 |
| 57TH | 26 |
| PERRY | 26 |
| FOREST HILL BLVD | 24 |
| MARTIN | 24 |
| WHITE PINE CR | 24 |
| 10TH AVE | 18 |
| SHERWOOD FOREST | 18 |
| SWAIN | 18 |
| WATERWAY VILLAGE CT | 18 |
| 38TH | 16 |
| DORCHESTER DR | 16 |
| FOXTAIL DR | 16 |
| LAKE WORTH | 16 |
| OLIVETREE CR | 16 |
| PURDY LN | 16 |
| WALKER | 14 |
| WHITE PINE | 14 |
| BROWARD | 12 |
| SEVEN SPRINGS | 12 |
2003 - 2018 National Fire Incident Reporting System (NFIRS) incidents
- Incident types reported to NFIRS in Greenacres, FL
- 16,54574.5%Rescue & EMS
- 1,7417.8%Good Intent Call
- 1,4466.5%Service Call
- 1,0324.6%Fire
- 9714.4%False Alarm
- 4522.0%Hazardous Condition
- Fire incident types reported to NFIRS in Greenacres, FL
- 42040.7%Structure Fires
- 40939.6%Outside Fires
- 16115.6%Mobile Property/Vehicle Fires
- 424.1%Other
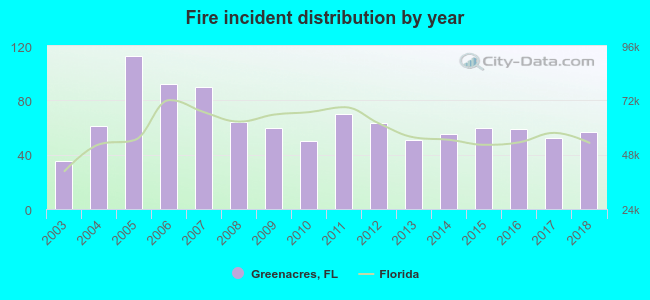 According to the data from the years 2003 - 2018 the average number of fires per year is 65. The highest number of fire incidents - 113 took place in 2005, and the least - 35 in 2003. The data has a growing trend.
The average number of yearly fire incidents per 10k residents in Greenacres, FL compared to nearest cities:
(Note: Based on data for the last 3 years, including only cities with population 5,000 and above)
| Greenacres: | 14.3 |
| Palm Springs: | 22.6 |
| Lake Worth: | 28.6 |
| Lantana: | 26.1 |
| West Palm Beach: | 39.1 |
| Wellington: | 8.3 |
| Royal Palm Beach: | 11.2 |
| Boynton Beach: | 15.6 |
| Palm Beach: | 41.6 |
 The median response time based on all reported fire incidents is 5 minutes. This is lower compared to the Florida median value.
The median response time in Greenacres, FL compared to nearest cities:
(Note: Based on data for all years, including only cities with at least 500 fire incidents)
| Greenacres: | 5 minutes |
| Lake Worth: | 6 minutes |
| West Palm Beach: | 6 minutes |
| Wellington: | 7 minutes |
| Boynton Beach: | 5 minutes |
| Riviera Beach: | 5 minutes |
| Delray Beach: | 5 minutes |
| North Palm Beach: | 5 minutes |
| Palm Beach Gardens: | 6 minutes |
 Based on the reports from the years 2003 - 2018 the average number of fire-related yearly casualties is 2. The highest number of injuries - 9 took place in 2011, and the lowest - 0 in 2003. The data has an increasing trend.
The average number of casualties per 1,000 fire incidents is 34. This indicator was the highest - 129 in 2011, and the lowest 0 in 2003. The trend for casualties per 1,000 fires is rising. Compared to the Florida value the number of casualties per 1,000 fire incidents is much higher.
Based on the reports from the years 2003 - 2018 the average number of fire-related yearly casualties is 2. The highest number of injuries - 9 took place in 2011, and the lowest - 0 in 2003. The data has an increasing trend.
The average number of casualties per 1,000 fire incidents is 34. This indicator was the highest - 129 in 2011, and the lowest 0 in 2003. The trend for casualties per 1,000 fires is rising. Compared to the Florida value the number of casualties per 1,000 fire incidents is much higher.Casualties per 1,000 incidents in Greenacres, FL compared to nearest cities:
(Note: Based on data for all years, including only cities with at least 500 fire incidents)
| Greenacres: | 34.9 |
| Lake Worth: | 38.4 |
| West Palm Beach: | 23.5 |
| Wellington: | 29.8 |
| Boynton Beach: | 17.3 |
| Riviera Beach: | 50.2 |
| Delray Beach: | 25.3 |
| North Palm Beach: | 33.8 |
| Palm Beach Gardens: | 4.4 |
 27.9% incidents where reported in the morning and 72.1% in the evening. The most fires (15.6%) took place on Saturday, and the least (12.1%) on Wednesday.
 Based on the 1,032 incident reports from years 2003 - 2018 most fires (12.7%) took place during April, and the least (6.1%) in August.
 Out of all 22,206 cases reported during the years 2003 - 2018, the most belonged to the categories: Rescue & EMS (74.5%), Good Intent Call (7.8%), and Service Call (6.5%).
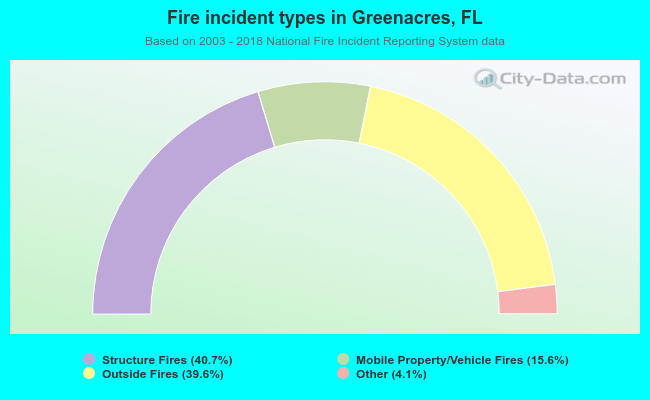 When looking into fire subcategories, the most incidents belonged to: Structure Fires (40.7%), and Outside Fires (39.6%).