Glendora: Fire Incidents, California (CA)
Where are fire incidents reported in Glendora, CA
Something went wrong! Please refresh the page.
|
| |||||||||||||||||||||||||||||||||||||||||||||||||||||||||||||||||||||||||||||||||||||||||||||||||||||||||||||
2005 - 2018 National Fire Incident Reporting System (NFIRS) incidents
- Incident types reported to NFIRS in Glendora, CA
- 13,16067.8%Rescue & EMS
- 3,17116.3%Good Intent Call
- 9424.9%False Alarm
- 8264.3%Service Call
- 7013.6%Fire
- 5672.9%Hazardous Condition
- 220.1%Special Incident
- Fire incident types reported to NFIRS in Glendora, CA
- 27839.7%Outside Fires
- 18526.4%Structure Fires
- 18025.7%Mobile Property/Vehicle Fires
- 588.3%Other
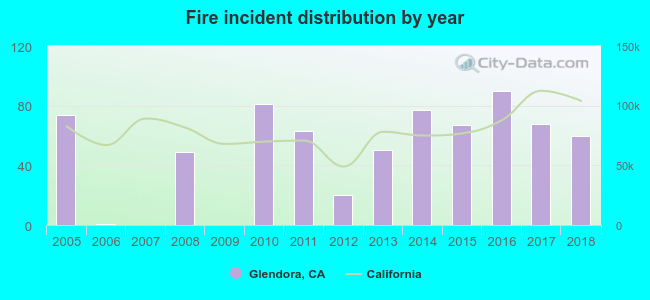 According to the data from the years 2005 - 2018 the average number of fires per year is 50. The highest number of fires - 90 took place in 2016, and the least - 0 in 2007. The data has a declining trend.
The average number of yearly fire incidents per 10k residents in Glendora, CA compared to nearest cities:
(Note: Based on data for the last 3 years, including only cities with population 5,000 and above)
| Glendora: | 14.1 |
| Charter Oak: | 6.4 |
| San Dimas: | 14.6 |
| Azusa: | 13.9 |
| Covina: | 12.7 |
| La Verne: | 17.0 |
| Duarte: | 13.0 |
| West Covina: | 5.2 |
| Walnut: | 8.6 |
 The median response time based on all reported fire incidents is 5 minutes. This is lower than the state median value.
The median response time in Glendora, CA compared to nearest cities:
(Note: Based on data for all years, including only cities with at least 500 fire incidents)
| Glendora: | 5 minutes |
| San Dimas: | 5 minutes |
| Azusa: | 5 minutes |
| Covina: | 4 minutes |
| La Verne: | 5 minutes |
| West Covina: | 6 minutes |
| Pomona: | 5 minutes |
| Baldwin Park: | 5 minutes |
| Claremont: | 5 minutes |
 35.7% incidents where reported in the morning and 64.3% in the evening. The most fires (15.8%) took place on Friday, and the least (10.8%) on Wednesday.
 According to the 701 fires from years 2005 - 2018 most fires (11.4%) took place during January, and the least (4.9%) in December.
 Out of all 19,405 cases reported during the years 2005 - 2018, the most belonged to the categories: Rescue & EMS (67.8%), Good Intent Call (16.3%), and False Alarm (4.9%).
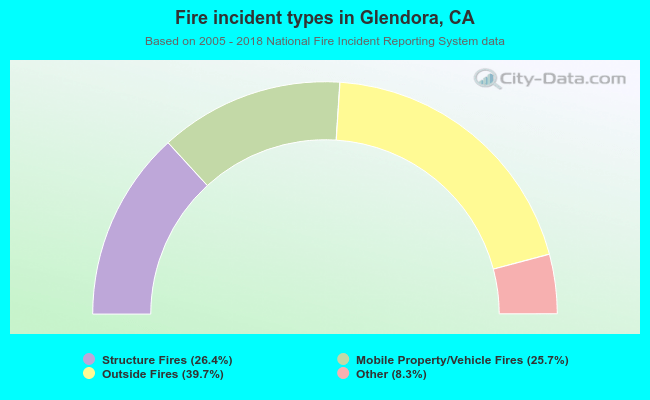 When looking into fire subcategories, the most incidents belonged to: Outside Fires (39.7%), and Structure Fires (26.4%).