Glen Rock: Fire Incidents, New Jersey (NJ)
Where are fire incidents reported in Glen Rock, NJ
Something went wrong! Please refresh the page.
|
| |||||||||||||||||||||||||||||||||||||||||||||||||||||||||||||||||||||||||||||||||||||||||||||||||||||||||||||
2002 - 2018 National Fire Incident Reporting System (NFIRS) incidents
- Incident types reported to NFIRS in Glen Rock, NJ
- 66130.4%Hazardous Condition
- 60027.6%False Alarm
- 41118.9%Fire
- 31414.4%Good Intent Call
- 1436.6%Service Call
- 331.5%Rescue & EMS
- 130.6%Severe Weather
- Fire incident types reported to NFIRS in Glen Rock, NJ
- 27466.7%Structure Fires
- 10826.3%Outside Fires
- 266.3%Mobile Property/Vehicle Fires
- 30.7%Other
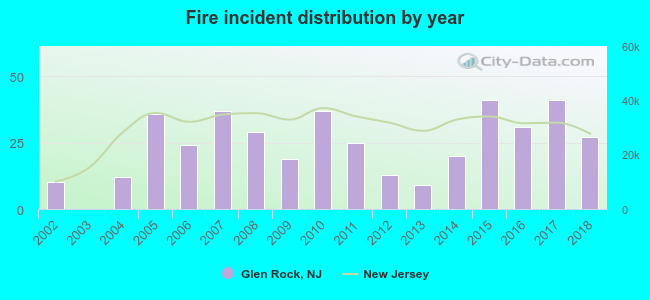 According to the data from the years 2002 - 2018 the average number of fires per year is 24. The highest number of fire incidents - 41 took place in 2015, and the least - 0 in 2003. The data has a rising trend.
The average number of yearly fire incidents per 10k residents in Glen Rock, NJ compared to nearest cities:
(Note: Based on data for the last 3 years, including only cities with population 5,000 and above)
| Glen Rock: | 27.7 |
| Hawthorne: | 15.5 |
| Ridgewood: | 22.1 |
| Fair Lawn: | 22.2 |
| Midland Park: | 19.6 |
| North Haledon: | 30.5 |
| Paramus: | 4.6 |
| Prospect Park: | 16.3 |
| Wyckoff: | 51.7 |

 26.5% incidents where reported in the morning and 73.5% in the evening. The most fires (17.8%) took place on Friday, and the least (11.2%) on Sunday.
 Based on the 411 fires from years 2002 - 2018 most fires (10.7%) took place during April, and the least (5.8%) in June.
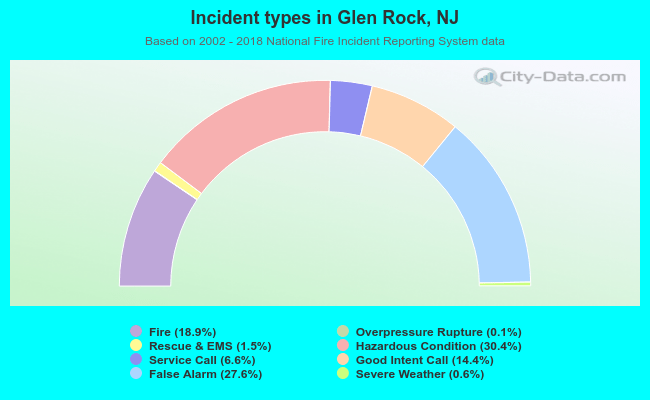 Out of all 2,177 cases reported during the years 2002 - 2018, the most belonged to the categories: Hazardous Condition (30.4%), False Alarm (27.6%), and Fire (18.9%).
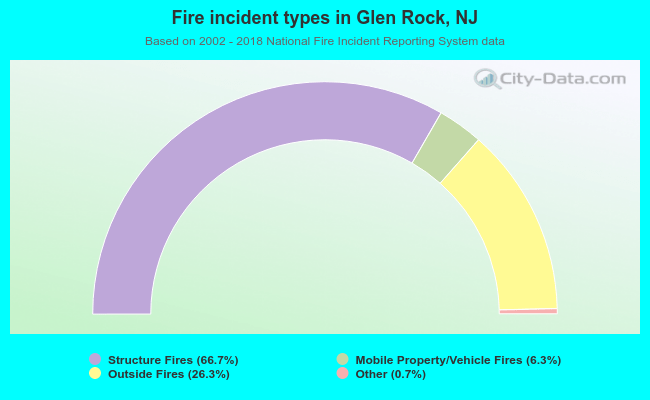 When looking into fire subcategories, the most incidents belonged to: Structure Fires (66.7%), and Outside Fires (26.3%).