Gladstone: Fire Incidents, Missouri (MO)
Where are fire incidents reported in Gladstone, MO
Something went wrong! Please refresh the page.
| Fire incidents reported | |
|---|---|
| Sreet name | Count |
| 72ND ST | 156 |
| OAK TRFY | 148 |
| ANTIOCH RD | 116 |
| OLIVE ST | 98 |
| MAIN ST | 70 |
| 63RD ST | 68 |
| BROADWAY AVE | 68 |
| 56TH TER | 66 |
| 68TH ST | 62 |
| FLORA AVE | 56 |
| PARK AVE | 52 |
| 64TH ST | 48 |
| WYANDOTTE ST | 48 |
| 59TH TER | 46 |
| BALES AVE | 46 |
| 61ST ST | 44 |
| 67TH ST | 42 |
| 60TH ST | 40 |
| 57TH TER | 36 |
| 58TH ST | 36 |
| 76TH TER | 36 |
| WOODLAND AVE | 36 |
| 67TH TER | 34 |
| 69TH ST | 34 |
| 76TH ST | 32 |
| 59TH ST | 30 |
| 74TH ST | 30 |
| TROOST AVE | 30 |
| 60TH TER | 28 |
| PROSPECT AVE | 28 |
2002 - 2018 National Fire Incident Reporting System (NFIRS) incidents
- Incident types reported to NFIRS in Gladstone, MO
- 12,76867.9%Rescue & EMS
- 1,6348.7%Service Call
- 1,5528.3%Hazardous Condition
- 1,4657.8%Fire
- 8824.7%False Alarm
- 4412.3%Good Intent Call
- 320.2%Special Incident
- 260.1%Overpressure Rupture
- Fire incident types reported to NFIRS in Gladstone, MO
- 69047.1%Structure Fires
- 51435.1%Outside Fires
- 21514.7%Mobile Property/Vehicle Fires
- 463.1%Other
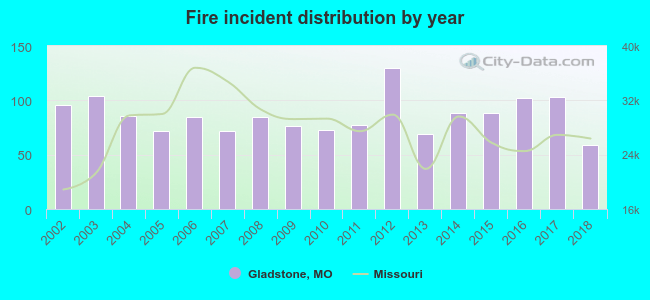 Based on the data from the years 2002 - 2018 the average number of fires per year is 86. The highest number of fire incidents - 130 took place in 2012, and the least - 59 in 2018. The data has a dropping trend.
The average number of yearly fire incidents per 10k residents in Gladstone, MO compared to nearest cities:
(Note: Based on data for the last 3 years, including only cities with population 5,000 and above)
| Gladstone: | 32.8 |
| Parkville: | 30.1 |
| Liberty: | 18.9 |
| Kansas City: | 38.0 |
| Smithville: | 27.8 |
| Independence: | 40.0 |
| Kearney: | 65.9 |
| Raytown: | 6.4 |
| Excelsior Springs: | 50.8 |
 The median response time based on all reported fire incidents is 4 minutes. This is lower compared to the Missouri median value.
The median response time in Gladstone, MO compared to nearest cities:
(Note: Based on data for all years, including only cities with at least 500 fire incidents)
| Gladstone: | 4 minutes |
| North Kansas City: | 4 minutes |
| Parkville: | 6 minutes |
| Liberty: | 6 minutes |
| Kansas City: | 5 minutes |
| Kansas City: | 5 minutes |
| Independence: | 5 minutes |
| Merriam: | 5 minutes |
| Kearney: | 7 minutes |
 Based on the data from the years 2002 - 2018 the average number of fire-related casualties per year is 2. The highest number of injuries - 5 took place in 2012, and the lowest - 0 in 2005. The data has a dropping trend.
The average number of injuries per 1,000 fires is 25. This indicator was the highest - 57 in 2014, and the lowest 0 in 2005. The trend for casualties per 1,000 incidents is declining. Compared to the state value the number of casualties per 1,000 fire incidents is much higher.
Based on the data from the years 2002 - 2018 the average number of fire-related casualties per year is 2. The highest number of injuries - 5 took place in 2012, and the lowest - 0 in 2005. The data has a dropping trend.
The average number of injuries per 1,000 fires is 25. This indicator was the highest - 57 in 2014, and the lowest 0 in 2005. The trend for casualties per 1,000 incidents is declining. Compared to the state value the number of casualties per 1,000 fire incidents is much higher.Casualties per 1,000 incidents in Gladstone, MO compared to nearest cities:
(Note: Based on data for all years, including only cities with at least 500 fire incidents)
| Gladstone: | 25.9 |
| North Kansas City: | 3.8 |
| Parkville: | 7.7 |
| Liberty: | 4.6 |
| Kansas City: | 9.7 |
| Kansas City: | 13.3 |
| Independence: | 16.0 |
| Merriam: | 9.6 |
| Kearney: | 2.2 |
 30.2% incidents where reported in the morning and 69.8% in the evening. The most fires (16.5%) took place on Saturday, and the least (12.5%) on Friday.
 According to the 1,465 fire incidents from years 2002 - 2018 most fires (9.6%) took place during March, and the least (7.0%) in September.
 Out of all 18,806 cases reported during the years 2002 - 2018, the most belonged to the categories: Rescue & EMS (67.9%), Service Call (8.7%), and Hazardous Condition (8.3%).
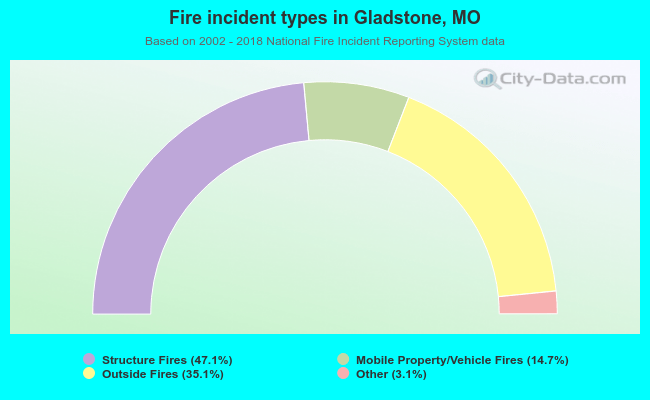 When looking into fire subcategories, the most reports belonged to: Structure Fires (47.1%), and Outside Fires (35.1%).