Gallup: Fire Incidents, New Mexico (NM)
Where are fire incidents reported in Gallup, NM
Something went wrong! Please refresh the page.
| Fire incidents reported | |
|---|---|
| Sreet name | Count |
| 66 HWY | 190 |
| HWY 66 | 70 |
| SECOND ST | 54 |
| AZTEC | 48 |
| 491 HWY | 40 |
| 66 | 40 |
| MALONEY | 40 |
| AZTEC AVE | 38 |
| MALONEY AVE | 38 |
| DANI DR | 36 |
| I40 HWY | 32 |
| 602 HWY | 26 |
| BOARDMAN | 26 |
| COAL BASIN RD | 24 |
| US 491 | 24 |
| 2ND ST | 20 |
| PERSHING | 20 |
| SECOND | 20 |
| COAL | 18 |
| APACHE CIR | 16 |
| BOARDMAN DR | 16 |
| HASSLER VALLEY RD | 16 |
| HWY 491 | 16 |
| NIZHONI BLVD | 16 |
| WILSON | 16 |
| BOYD AVE | 14 |
| BUENA VISTA | 14 |
| HILL | 14 |
| HILL AVE | 14 |
| MONTOYA | 14 |
| Other | 836 |
2005 - 2018 National Fire Incident Reporting System (NFIRS) incidents
- Incident types reported to NFIRS in Gallup, NM
- 16,94479.4%Rescue & EMS
- 1,8068.5%Fire
- 9894.6%Hazardous Condition
- 7403.5%False Alarm
- 5392.5%Good Intent Call
- 2731.3%Service Call
- 320.1%Special Incident
- Fire incident types reported to NFIRS in Gallup, NM
- 84746.9%Outside Fires
- 40922.6%Structure Fires
- 30016.6%Mobile Property/Vehicle Fires
- 25013.8%Other
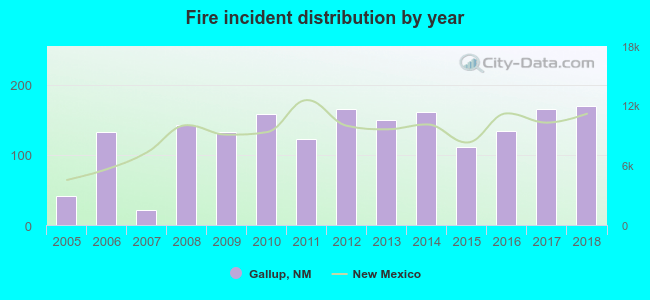 According to the data from the years 2005 - 2018 the average number of fires per year is 129. The highest number of fire incidents - 170 took place in 2018, and the least - 21 in 2007. The data has a growing trend.
 The median response time based on all reported fire incidents is 6 minutes. This is lower compared to the New Mexico median value.
The median response time in Gallup, NM compared to nearest cities:
(Note: Based on data for all years, including only cities with at least 500 fire incidents)
| Gallup: | 6 minutes |
| Grants: | 4 minutes |
 Based on the reports from the years 2005 - 2018 the average number of fire-related fatalities per year is 1. The highest number of deaths - 3 took place in 2016, and the lowest - 0 in 2005. The data has a constant trend.
 33.4% incidents where reported in the morning and 66.6% in the evening. The most fires (15.5%) took place on Saturday, and the least (13.0%) on Monday.
 Based on the 1,806 fire incidents from years 2005 - 2018 most fires (12.4%) took place during June, and the least (5.7%) in September.
 Out of all 21,336 cases reported during the years 2005 - 2018, the most belonged to the categories: Rescue & EMS (79.4%), Fire (8.5%), and Hazardous Condition (4.6%).
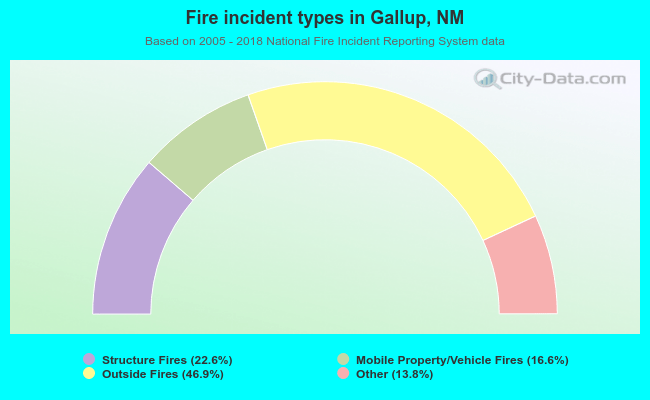 When looking into fire subcategories, the most incidents belonged to: Outside Fires (46.9%), and Structure Fires (22.6%).