Galesburg: Fire Incidents, Illinois (IL)
Where are fire incidents reported in Galesburg, IL
Something went wrong! Please refresh the page.
| Fire incidents reported | |
|---|---|
| Sreet name | Count |
| HENDERSON ST | 218 |
| MAIN ST | 176 |
| SEMINARY ST | 102 |
| CARL SANDBURG DR | 86 |
| SOUTH ST | 82 |
| CHAMBERS ST | 78 |
| NORTH ST | 76 |
| KNOX ST | 72 |
| TOMPKINS ST | 70 |
| WEST ST | 70 |
| CHERRY ST | 62 |
| FARNHAM ST | 62 |
| BROAD ST | 60 |
| BROOKS ST | 60 |
| CEDAR ST | 60 |
| MONMOUTH BLVD | 60 |
| FREMONT ST | 58 |
| GRAND AVE | 56 |
| MICHIGAN AVE | 54 |
| ACADEMY ST | 48 |
| KELLOGG ST | 48 |
| LOSEY ST | 48 |
| BERRIEN ST | 44 |
| LORRAINE DR | 42 |
| SIMMONS ST | 40 |
| MAPLE AVE | 38 |
| LAKE STOREY RD | 36 |
| PRAIRIE ST | 36 |
| FIFTH ST | 34 |
| US HWY 34 | 34 |
| Other | 68 |
2002 - 2018 National Fire Incident Reporting System (NFIRS) incidents
- Incident types reported to NFIRS in Galesburg, IL
- 15,15854.7%Rescue & EMS
- 3,51112.7%Good Intent Call
- 2,6189.4%Hazardous Condition
- 2,1567.8%Service Call
- 2,1517.8%False Alarm
- 2,0787.5%Fire
- Fire incident types reported to NFIRS in Galesburg, IL
- 98547.4%Structure Fires
- 69433.4%Outside Fires
- 38718.6%Mobile Property/Vehicle Fires
- 120.6%Other
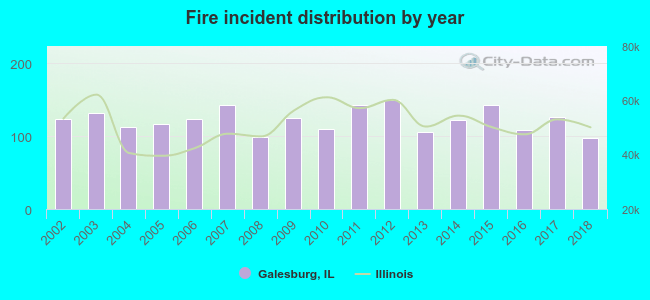 Based on the data from the years 2002 - 2018 the average number of fire incidents per year is 122. The highest number of reported fires - 149 took place in 2012, and the least - 98 in 2018. The data has a declining trend.
 The median response time based on all reported fire incidents is 4 minutes. This is lower compared to the state median value.
 Based on the reports from the years 2002 - 2018 the average number of fire-related yearly deaths is 0. The highest number of reported deaths - 2 took place in 2008, and the lowest - 0 in 2002. The data has a constant trend.
 According to the data from the years 2002 - 2018 the average number of fire-related yearly casualties is 2. The highest number of casualties - 7 took place in 2009, and the lowest - 0 in 2013. The data has a decreasing trend.
The average number of casualties per 1,000 fire incidents is 20. This indicator was the highest - 56 in 2009, and the lowest 0 in 2013. The trend for casualties per 1,000 fires is dropping. Compared to the state value the number of injuries per 1,000 fire incidents is higher.
According to the data from the years 2002 - 2018 the average number of fire-related yearly casualties is 2. The highest number of casualties - 7 took place in 2009, and the lowest - 0 in 2013. The data has a decreasing trend.
The average number of casualties per 1,000 fire incidents is 20. This indicator was the highest - 56 in 2009, and the lowest 0 in 2013. The trend for casualties per 1,000 fires is dropping. Compared to the state value the number of injuries per 1,000 fire incidents is higher.
 33.4% incidents where reported in the morning and 66.6% in the evening. The most fires (15.4%) took place on Saturday, and the least (13.0%) on Thursday.
 Based on the 2,078 reports from years 2002 - 2018 most fires (11.1%) took place during April, and the least (6.3%) in February.
 Out of all 27,732 cases reported during the years 2002 - 2018, the most belonged to the categories: Rescue & EMS (54.7%), Good Intent Call (12.7%), and Hazardous Condition (9.4%).
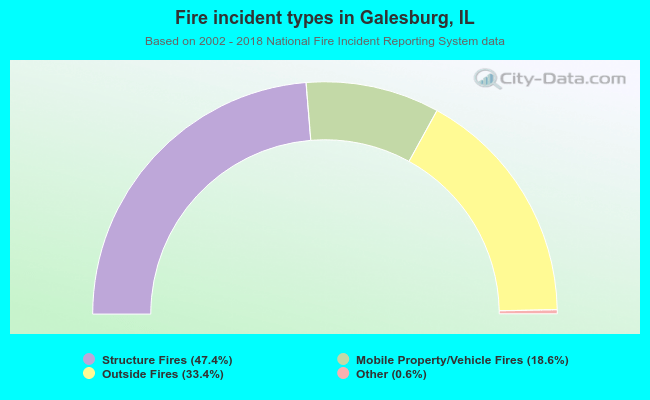 When looking into fire subcategories, the most incidents belonged to: Structure Fires (47.4%), and Outside Fires (33.4%).